I decided to build a Raspberry Pi cluster to give me a platform with which I can practice distributed computing technologies without needing to rely on a cloud provider.
This first post details my hardware set-up as well as how I used Ansible to “remote control” the installation of monitoring software on each of the Pi hosts, with the goal to observe the Raspberry Pi CPU temperatures.
Hardware
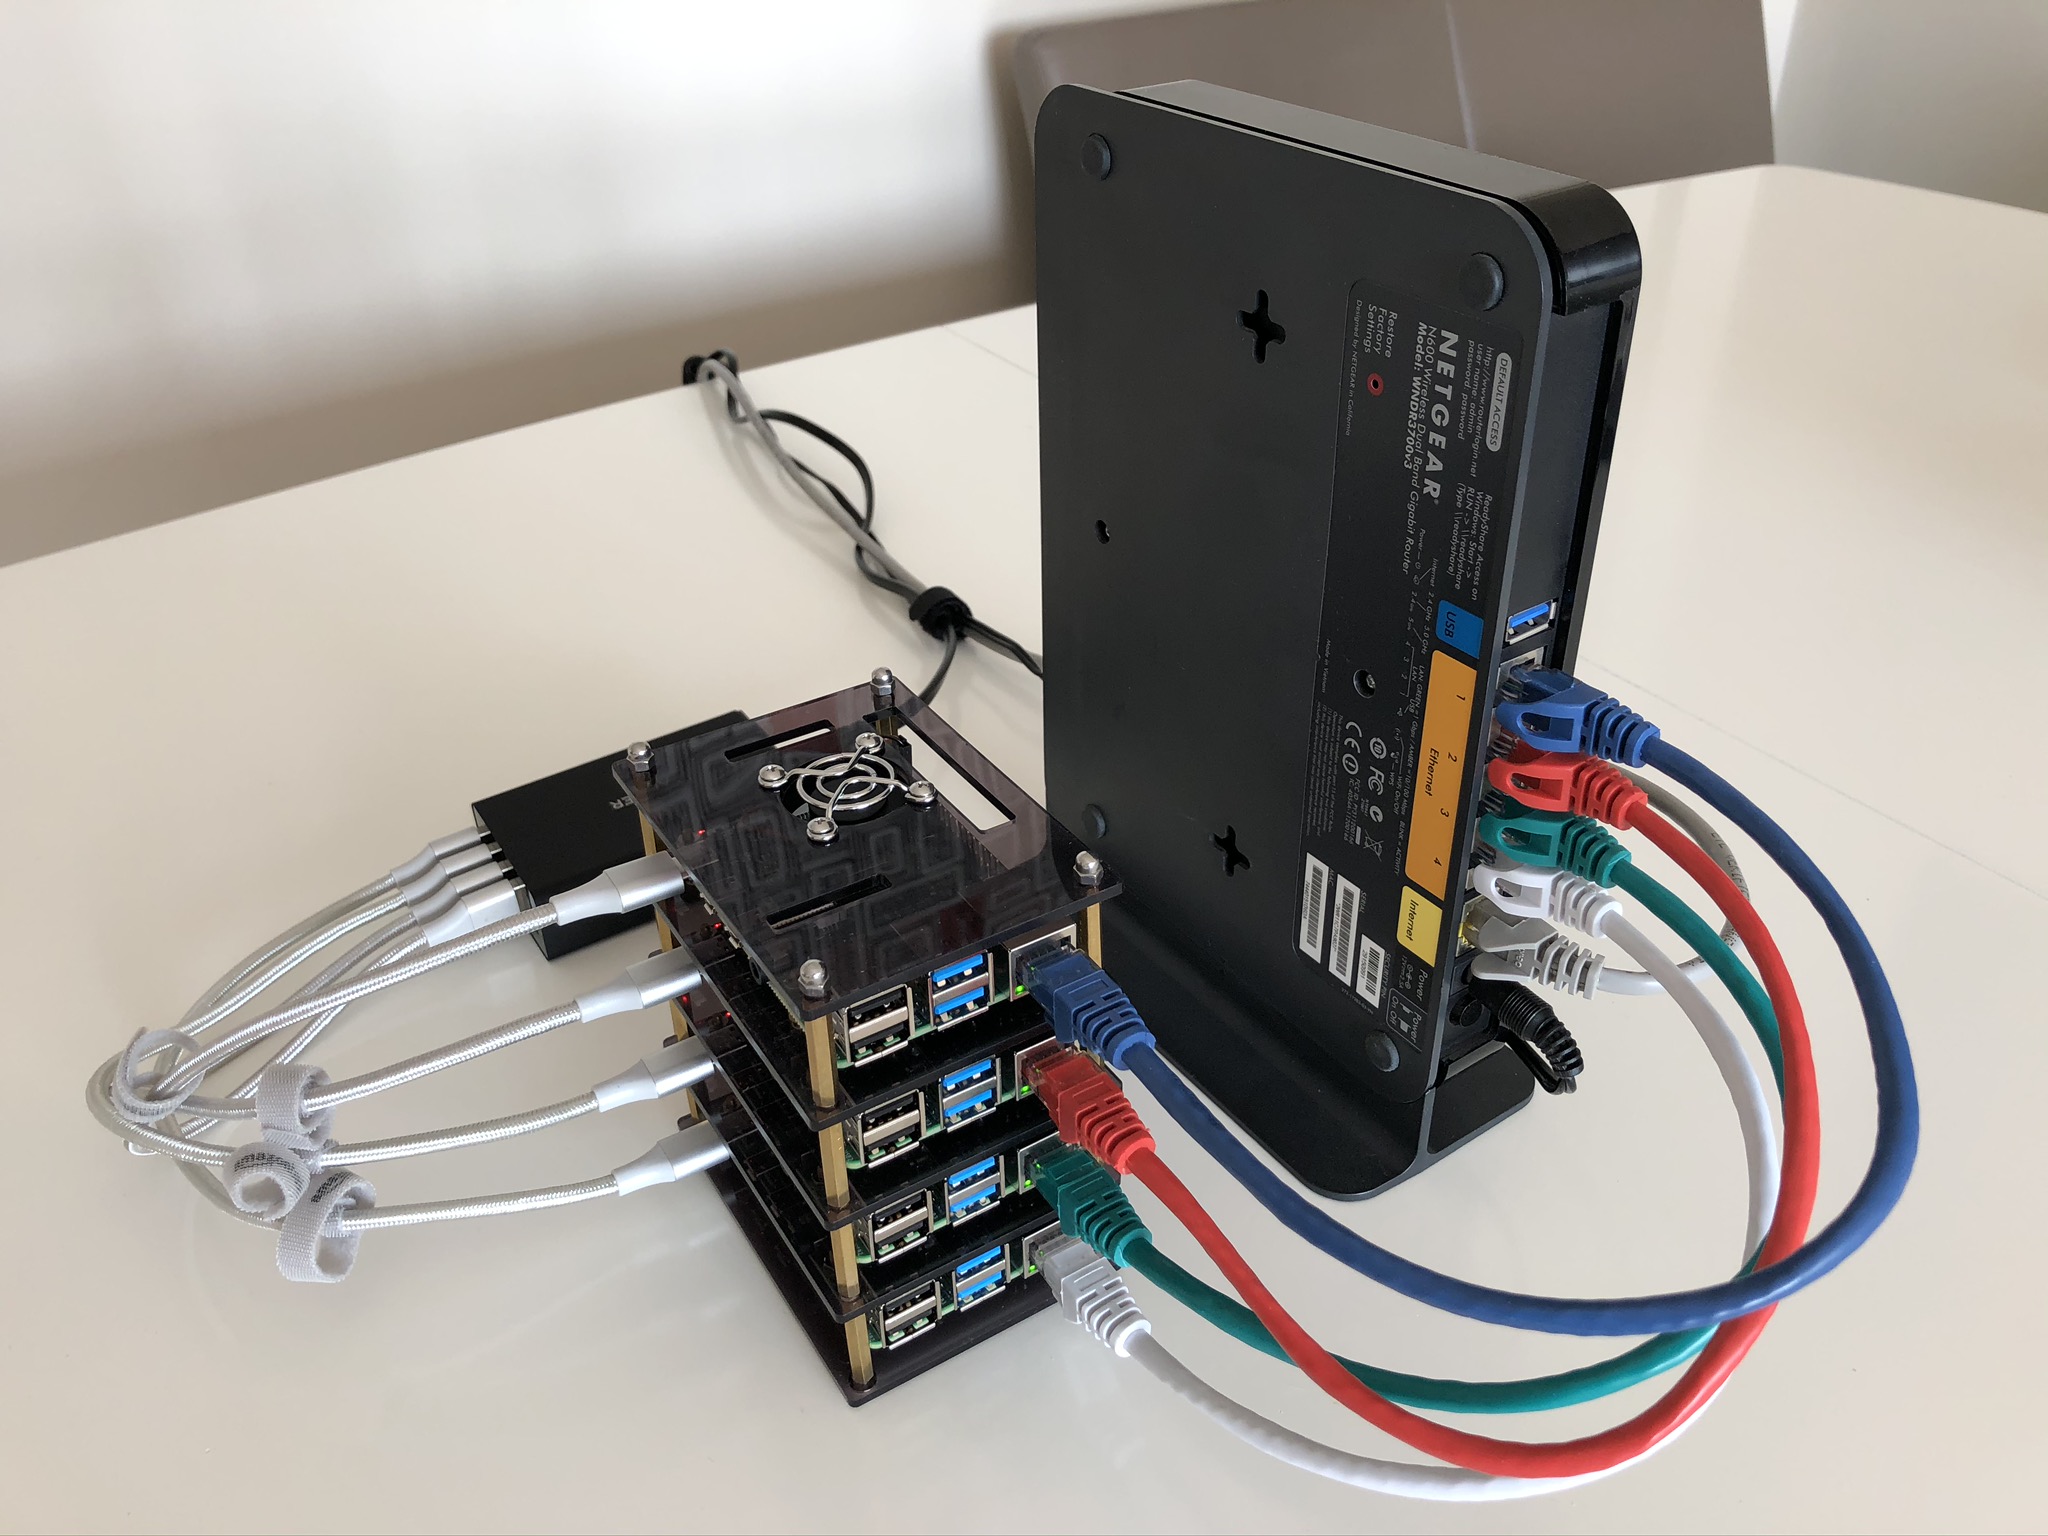
These are the various hardware components which make up my cluster:
- 4x Raspberry Pi 4 Model B 4GB
- I found a local seller on eBay who had a decent price on some unopened Pi 4 models.
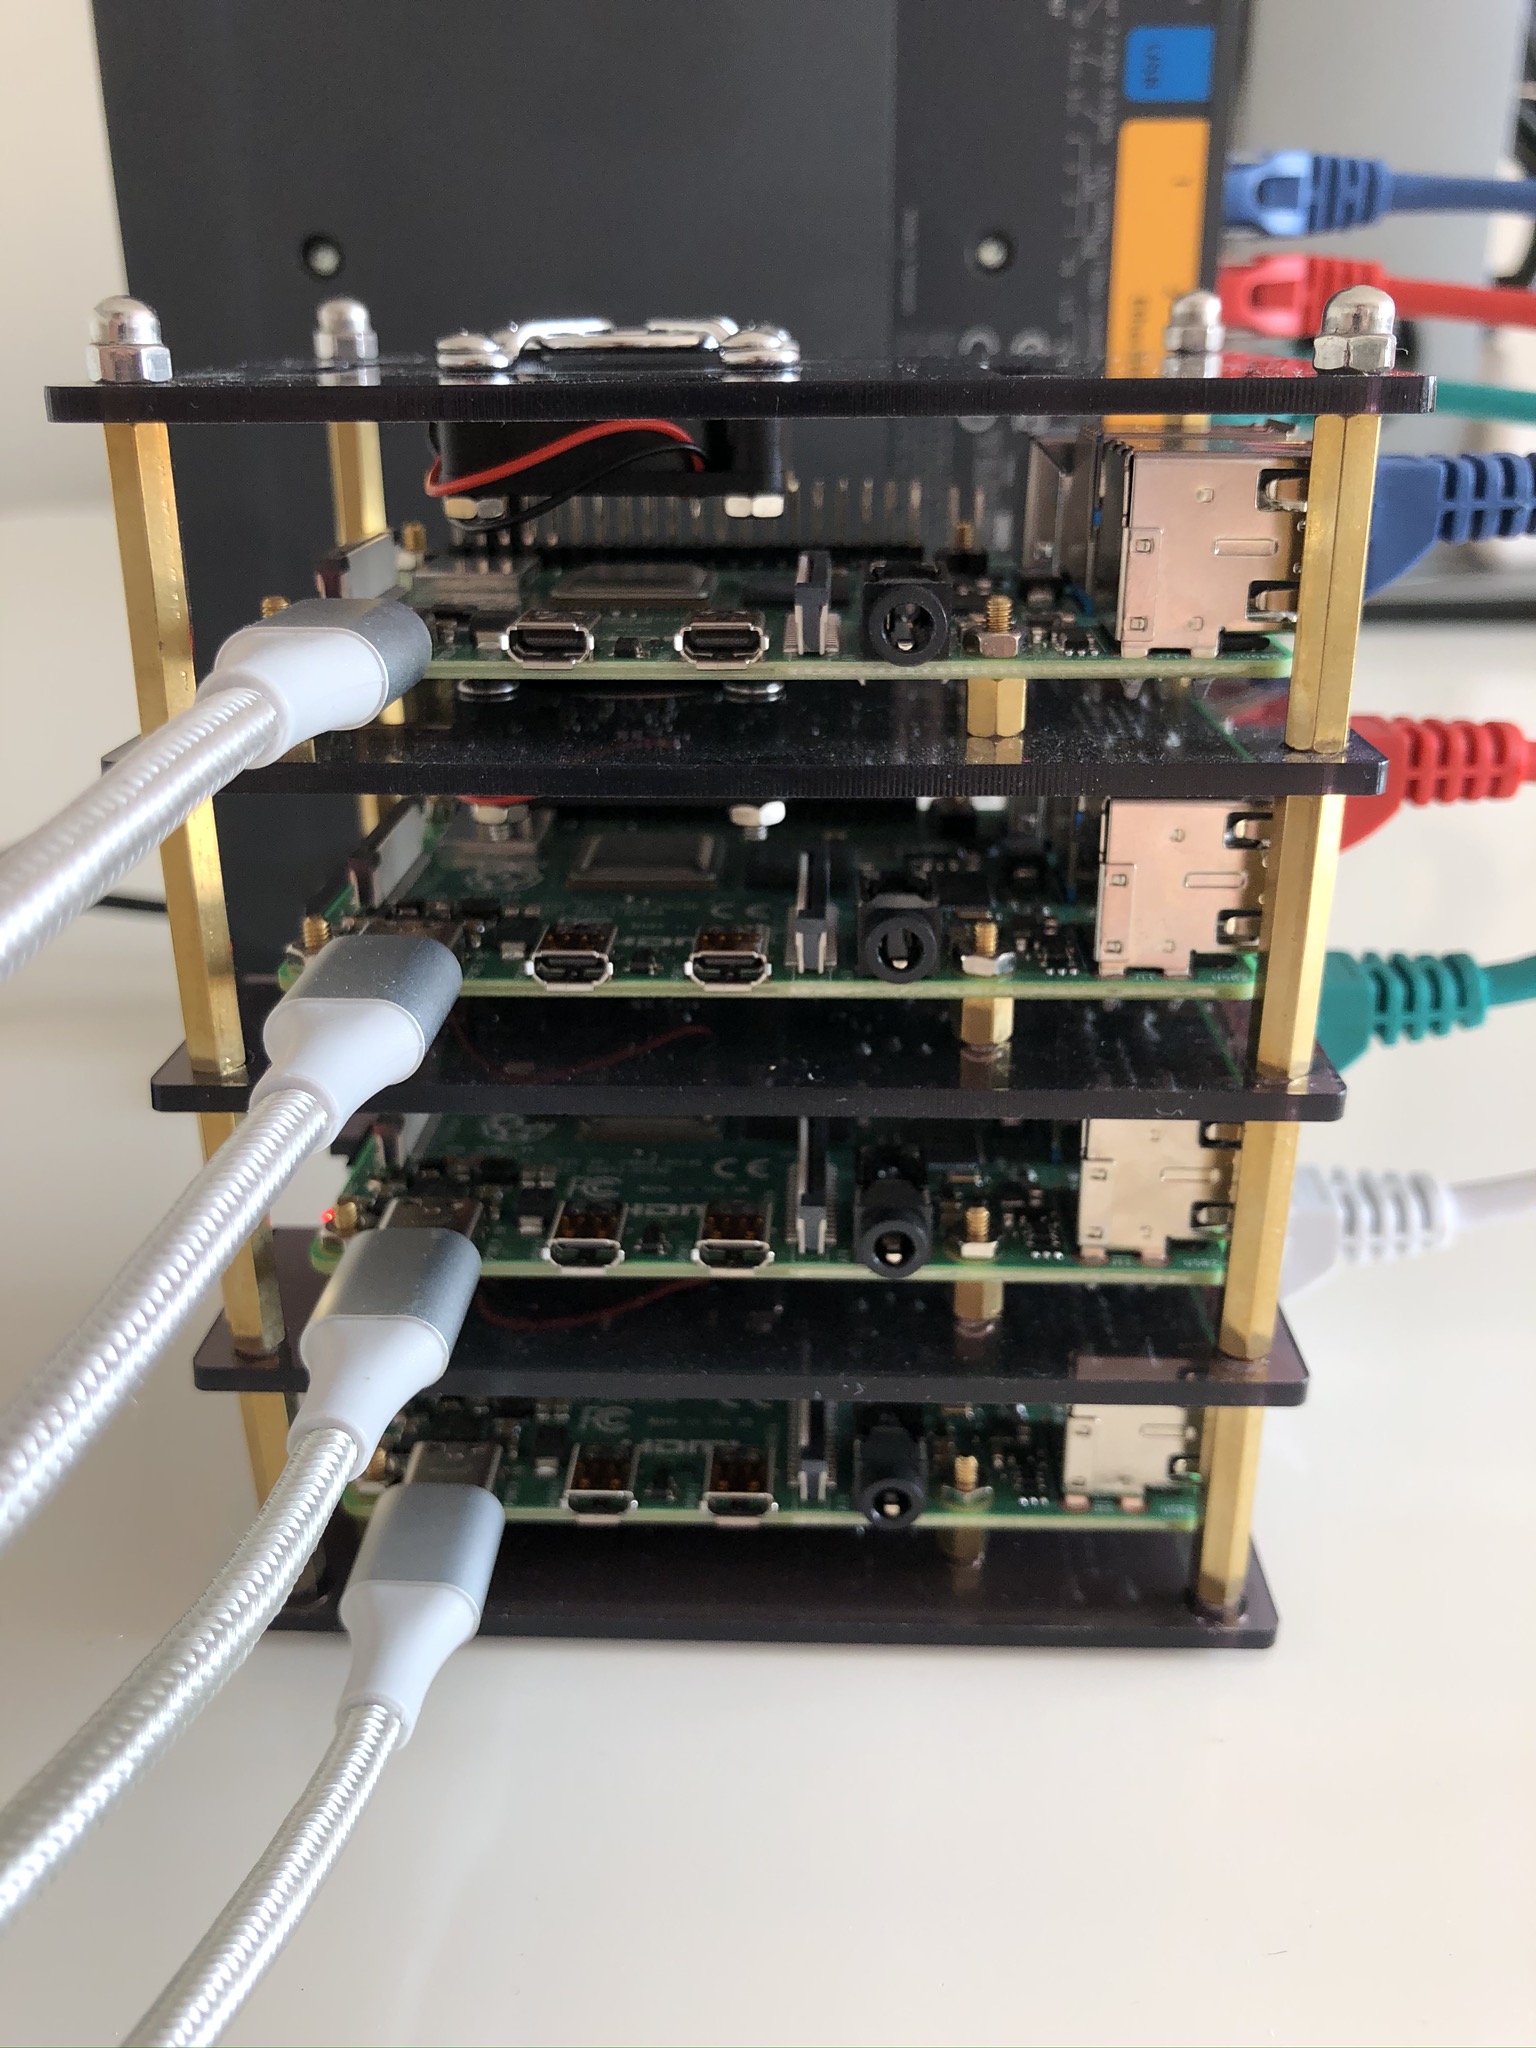
- 1x Pi Rack Case
- Includes fans and heat sinks for 4x Pi.
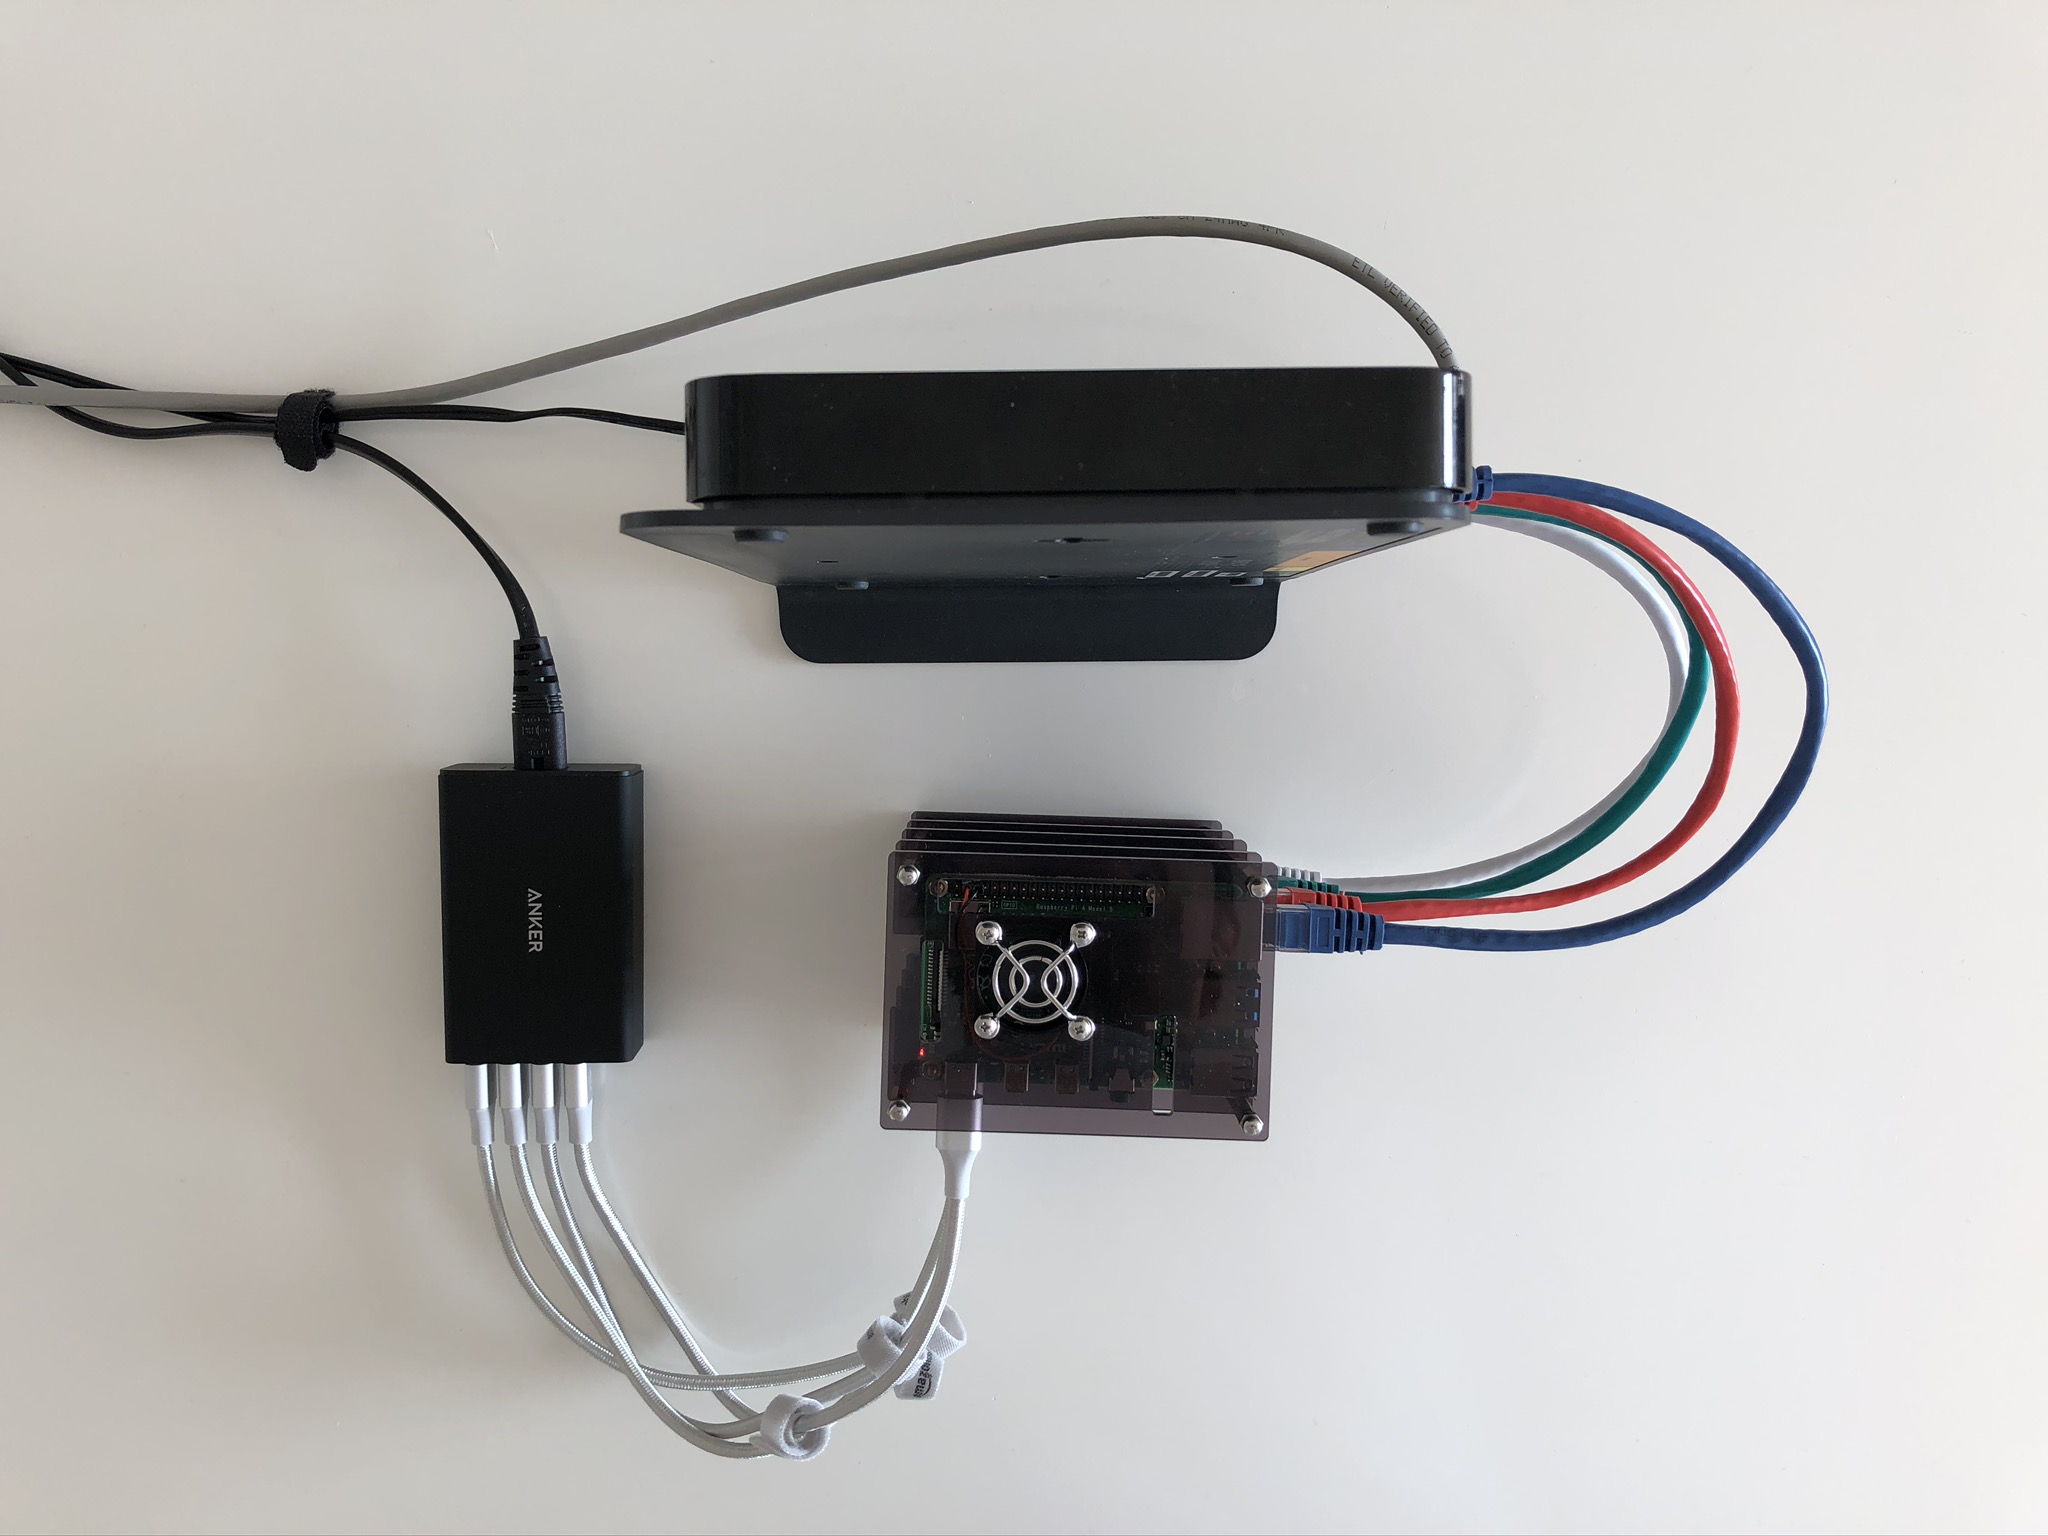
- 1x Anker USB Charger PowerPort 5
- 1x Netgear N600 Wireless Dual Band Gigabit Router WNDR3700v3
- Originally purchased in 2012, I’ve had this router sitting unused in a cupboard for a few years.
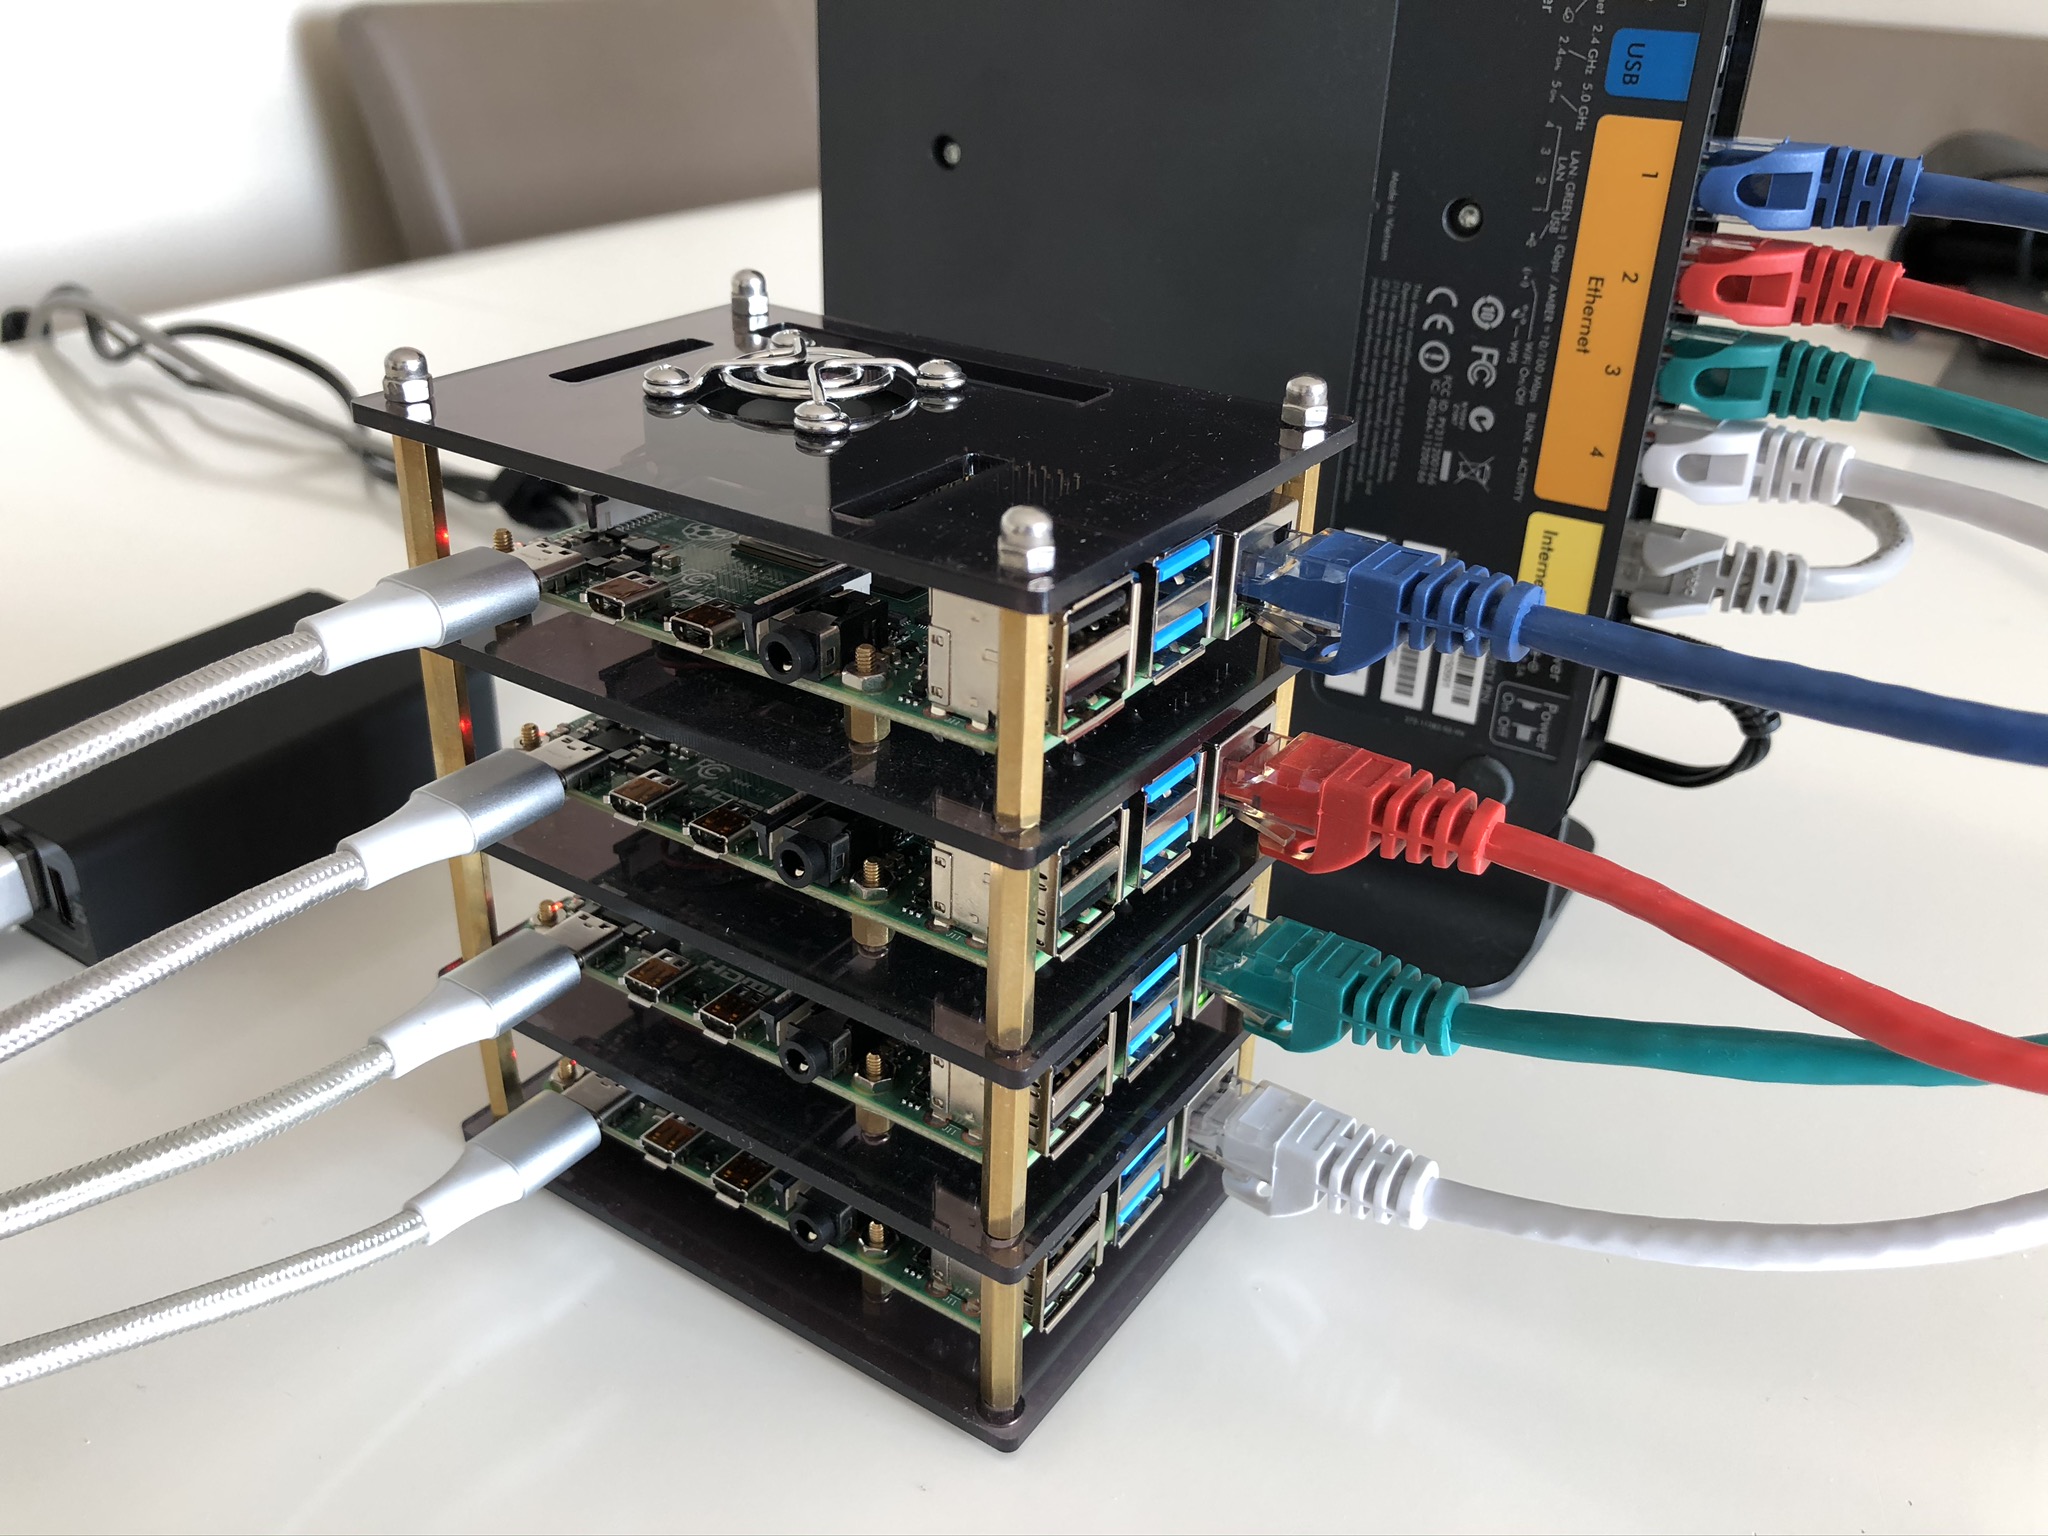
- It has 1x Internet port, 4x LAN ports and dual band WiFi. I’ve connected a cable from my ISP router to the Internet port, plugged the 4x Pi into the remaining LAN ports and I connect my laptop to this network via WiFi.
- 1x 5 pack RJ45 Cat6 0.3m patch cables
- 4x AmazonBasics 0.3m USB Type-C to Type-A cable
- 4x Samsung EVO Select 32 GB micro SD card
So far all my choices are serving me well. I can see why one might opt to use “flat” network cables, but at the time they were quite a bit more expensive than the pack of 5 that I ended up buying. If I decide to go “mobile” with the cluster I will think about getting a smaller router, one that may be powered from 5V USB as I have an unused port on the Anker PowerPort.
Operating System Set-up
I flashed the latest release (2020-02-13) of Raspbian Lite to each of the microSD cards, and also enabled SSH access on boot by adding an empty ssh file on the boot partition.
I inserted the microSD cards into the slots on each of the Pi, and then one Pi at a time performed the following:
- Plug in the USB C power cable.
- Wait around 30 seconds for the Pi to boot up and start the SSH server.
- SSH into the Pi from my laptop, using the default username (
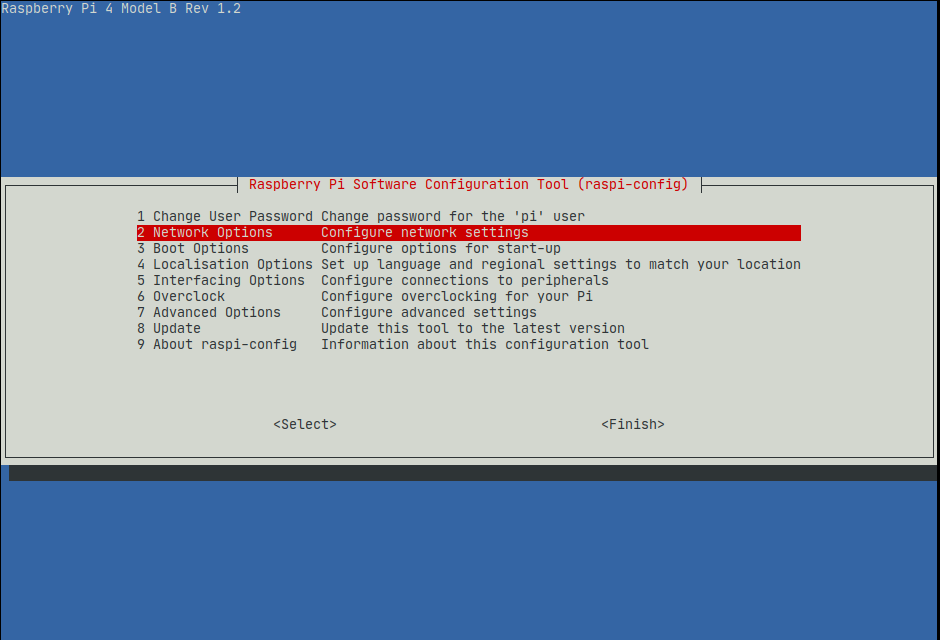
pi) and password (raspberry). - Once logged into the Pi, I ran
sudo raspi-configto enter the Raspberry Pi configuration tool, and modified the following:- Set the hostname. As I have a different colour Ethernet cable for each Pi, I used the colour as part of the hostname, e.g. “bluepi”.
- Expand the file system.
- Reduce the GPU memory to 16 MB (I set it to the minimum as I’ll likely never connect a display to any of the Pi).
- Enabled SSH access.
- Reboot the Pi on exit of
raspi-config.
Network Set-up
Static IPs
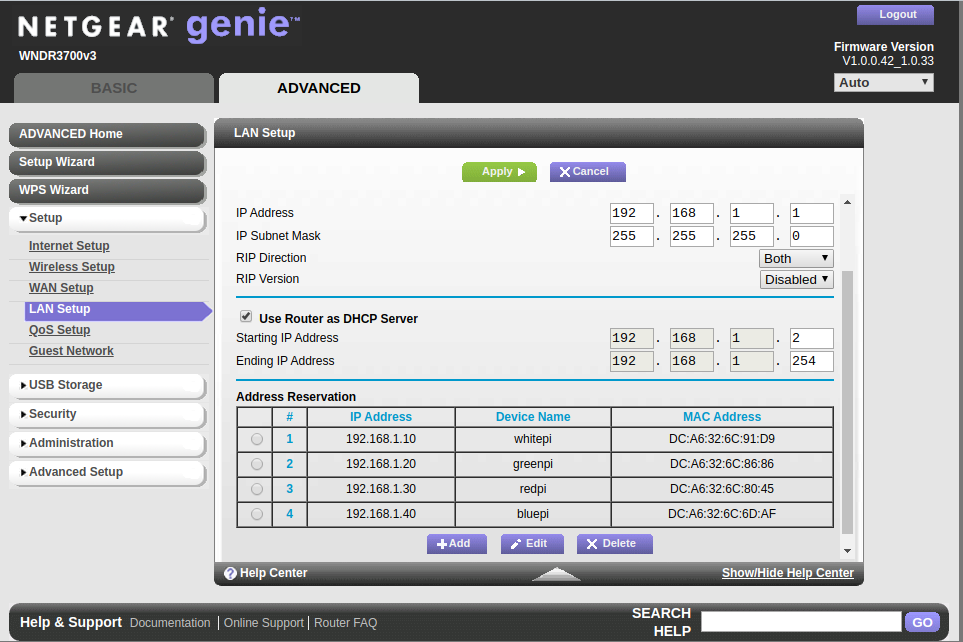
The reason behind plugging in the power cable one-by-one for each Pi is that at the same time as configuring the OS described above I also configured a static IP address for each Pi on my Netgear router. Doing it one-by-one makes it more obvious which MAC address belongs to which Pi. This makes it easier to troubleshoot network issues by knowing which Pi is assigned to which IP address.
Copy SSH public key
Next I copied across the SSH public key from my laptop to each Pi:
$ ssh-copy-id [email protected]
$ ssh-copy-id [email protected]
$ ssh-copy-id [email protected]
$ ssh-copy-id [email protected]
This will allow me to SSH in to each Pi without being prompted for a username and password, and will also make execution of the the Ansible tasks much easier.
Software
For this phase of the project I want to install some monitoring software to track system resources, and especially the Pi CPU temperatures. I chose the popular combination of Prometheus for metrics collection and Grafana for dashboard visualisation as my monitoring suite. To provide the Prometheus server with measurements I am using the popular node_exporter package which makes a multitude of system resources available for metrics collection. Raspberry Pi CPU temperature measurements are supplied by another Prometheus exporter tool aptly named RPi exporter.
Resources
- Monitor your Raspberry Pi cluster with Prometheus by Alex Ellis
- I’m not sure it’s possible to write anything about Raspberry Pi clusters without mentioning Alex Ellis :)
- Monitoring With Prometheus Using Ansible by Mitesh Sharma
Ansible
Disclaimer: I am not an Ansible expert. I’ve done a bunch of copying, pasting and tweaking from various sources to cobble together enough to get things working for me. I am positive there is a better way to use Ansible, hopefully I end up learning it!
Having to SSH into 4 machines and run the same commands to update and install the software sounded tedious - and what happens if I need to start over and repeat the steps? This is where Ansible comes in. Ansible is a provisioning and configuration management tool which allows one to script tasks to be executed on multiple target hosts. Groups of tasks and related metadata (variables, templates) can be specified by “roles”. Target hosts are defined in an inventory file. The definition of which roles should be applied to which hosts can be found in an Ansible Playbook file. With Ansible I can describe a series of tasks that I wish to be executed on my Pi hosts in Ansible playbooks, which can be run from a shell on my laptop without needing to SSH into each Pi individually myself.
Here is my collection of Ansible-related roles and playbooks: https://github.com/dinofizz/picluster-ansible. It contains some other playbooks that I have been using for my next phase of Pi Cluster operations :)
As an example, here is my inventory file inventory.yml. You can see how I am using the hostnames which I created during the OS configuration. This way I don’t need to use IP addresses (even though I did make my life easier by setting static IPs for each Pi).
---
all:
  hosts:
    whitepi:
      ansible_host: whitepi.local
    greenpi:
      ansible_host: greenpi.local
    redpi:
      ansible_host: redpi.local
    bluepi:
      ansible_host: bluepi.local
  children:
    raspberry_pi:
      hosts:
        whitepi: {}
        greenpi: {}
        redpi: {}
        bluepi: {}
    monitoring_server:
      hosts:
        whitepi: {}
  vars:
    ansible_python_interpreter: /usr/bin/python3
    remote_user: pi
Above you can see that I have labelled all my hosts by their hostname. I have created two distinct sets of hosts:
- raspberry_pi : This is essentially ALL my hosts.
- monitoring_server: The host which will have the monitoring server software installed and running.
The main playbook which I use to update and install software is up.yml:
---
- hosts: raspberry_pi
  user: pi
  become: yes
  become_user: root
  become_method: sudo
  roles:
    - common
    - rpi_exporter
    - node_exporter

- hosts: monitoring_server
  user: pi
  become: yes
  become_user: root
  become_method: sudo
  roles:
    - monitoring_server
To run the playbook I issue the following command from my picluster-ansible repository project directory:
$ ansible-playbook up.yml -i inventory.yml
This will update all software packages and install all the monitoring exporter tools on each Raspberry Pi host (as defined in the inventory.yml file). There is a separate section for the installation of the monitoring software (Prometheus and Grafana) which is applied only to the host defined as the monitoring_server in the inventory.yml file.
For details on the actual tasks involved in provisioning the hosts please explore the GitHub repository.
Prometheus
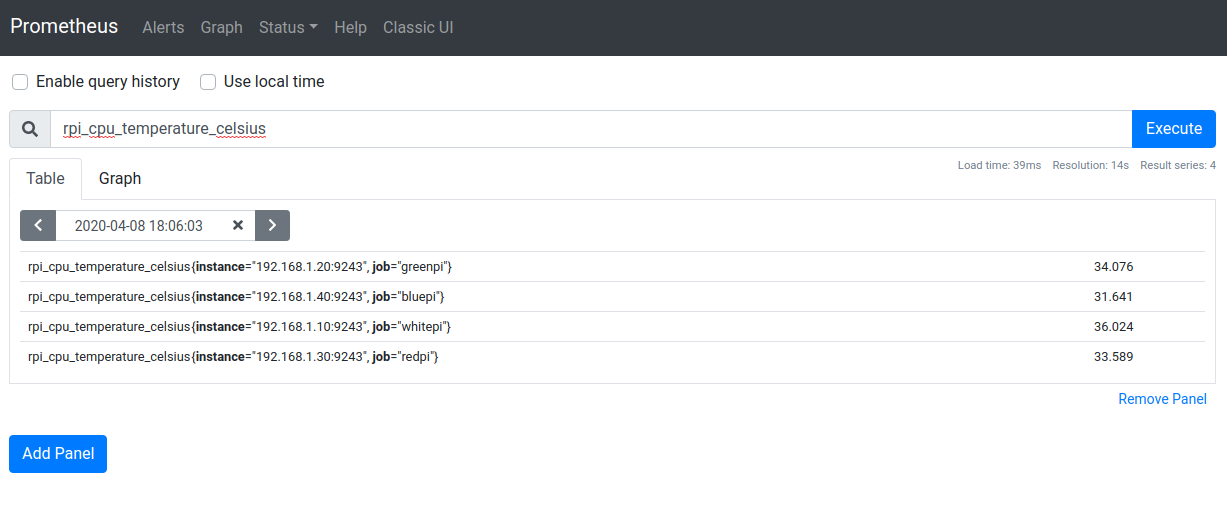
After running the up.yml Ansible playbook I have Prometheus installed and running, as well as the exporter tools running on each Pi. This can be verified by visiting the Prometheus web UI running on my monitoring_server host at http://whitepi.local:9090. Using the RPi Exporter I can use the web UI directly to view the current temperature measurements using the query rpi_cpu_temperature_celsius:
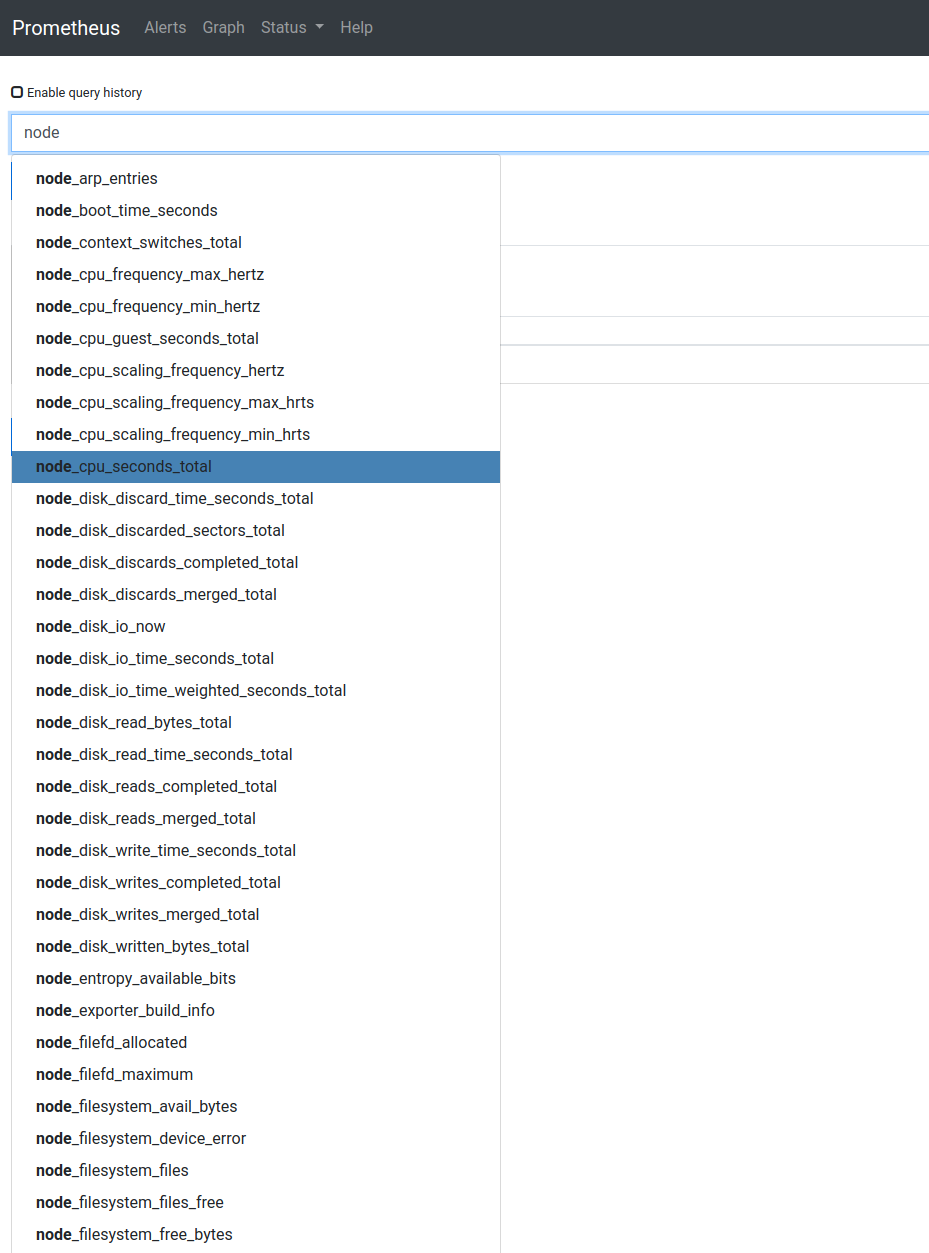
There are many more measurements which can be queried, typically prefixed by the exporter name. Here are some of the measurements available from the node_exporter:
Grafana
While Prometheus does have the ability to display and even graph exported measurements, there are much better tools for this job. Grafana is an open source metrics visualisation tool which I am using to create dashboards for my Pi cluster.
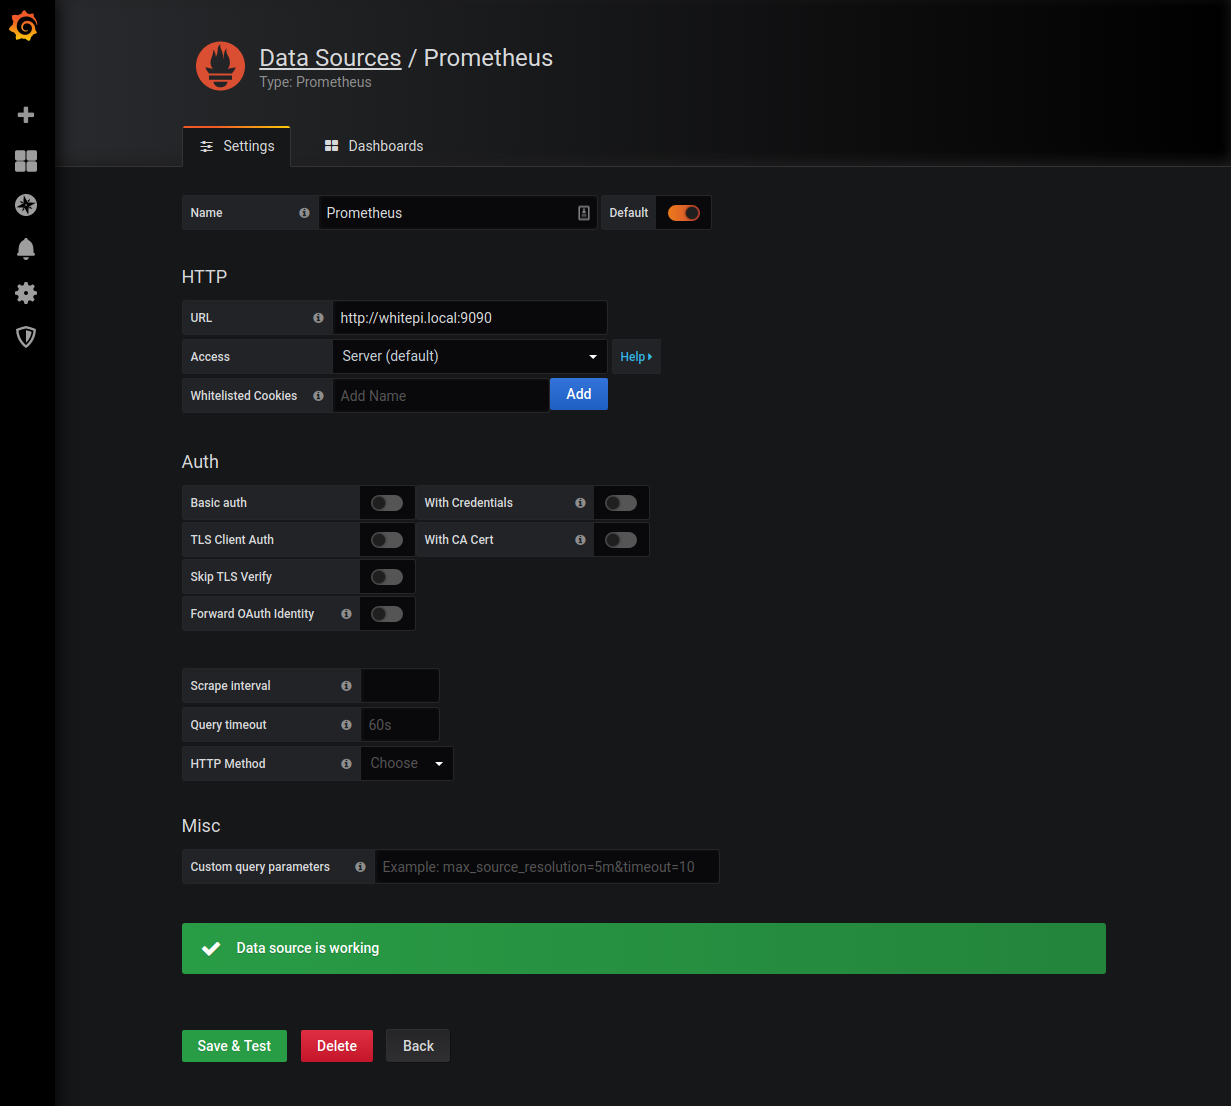
Grafana was installed with the up.yml Ansible playbook, and can be accessed on the monitoring_server host on port 3030: http://whitepi.local:3030. While Grafana can take some time to become familiar with, it essentially allows for a collection of “panels” to be grouped together as a dashboard. Grafana supports multiple data sources, one of which is Prometheus. After logging in and changing the default admin password I selected Prometheus as a data source for Grafana:
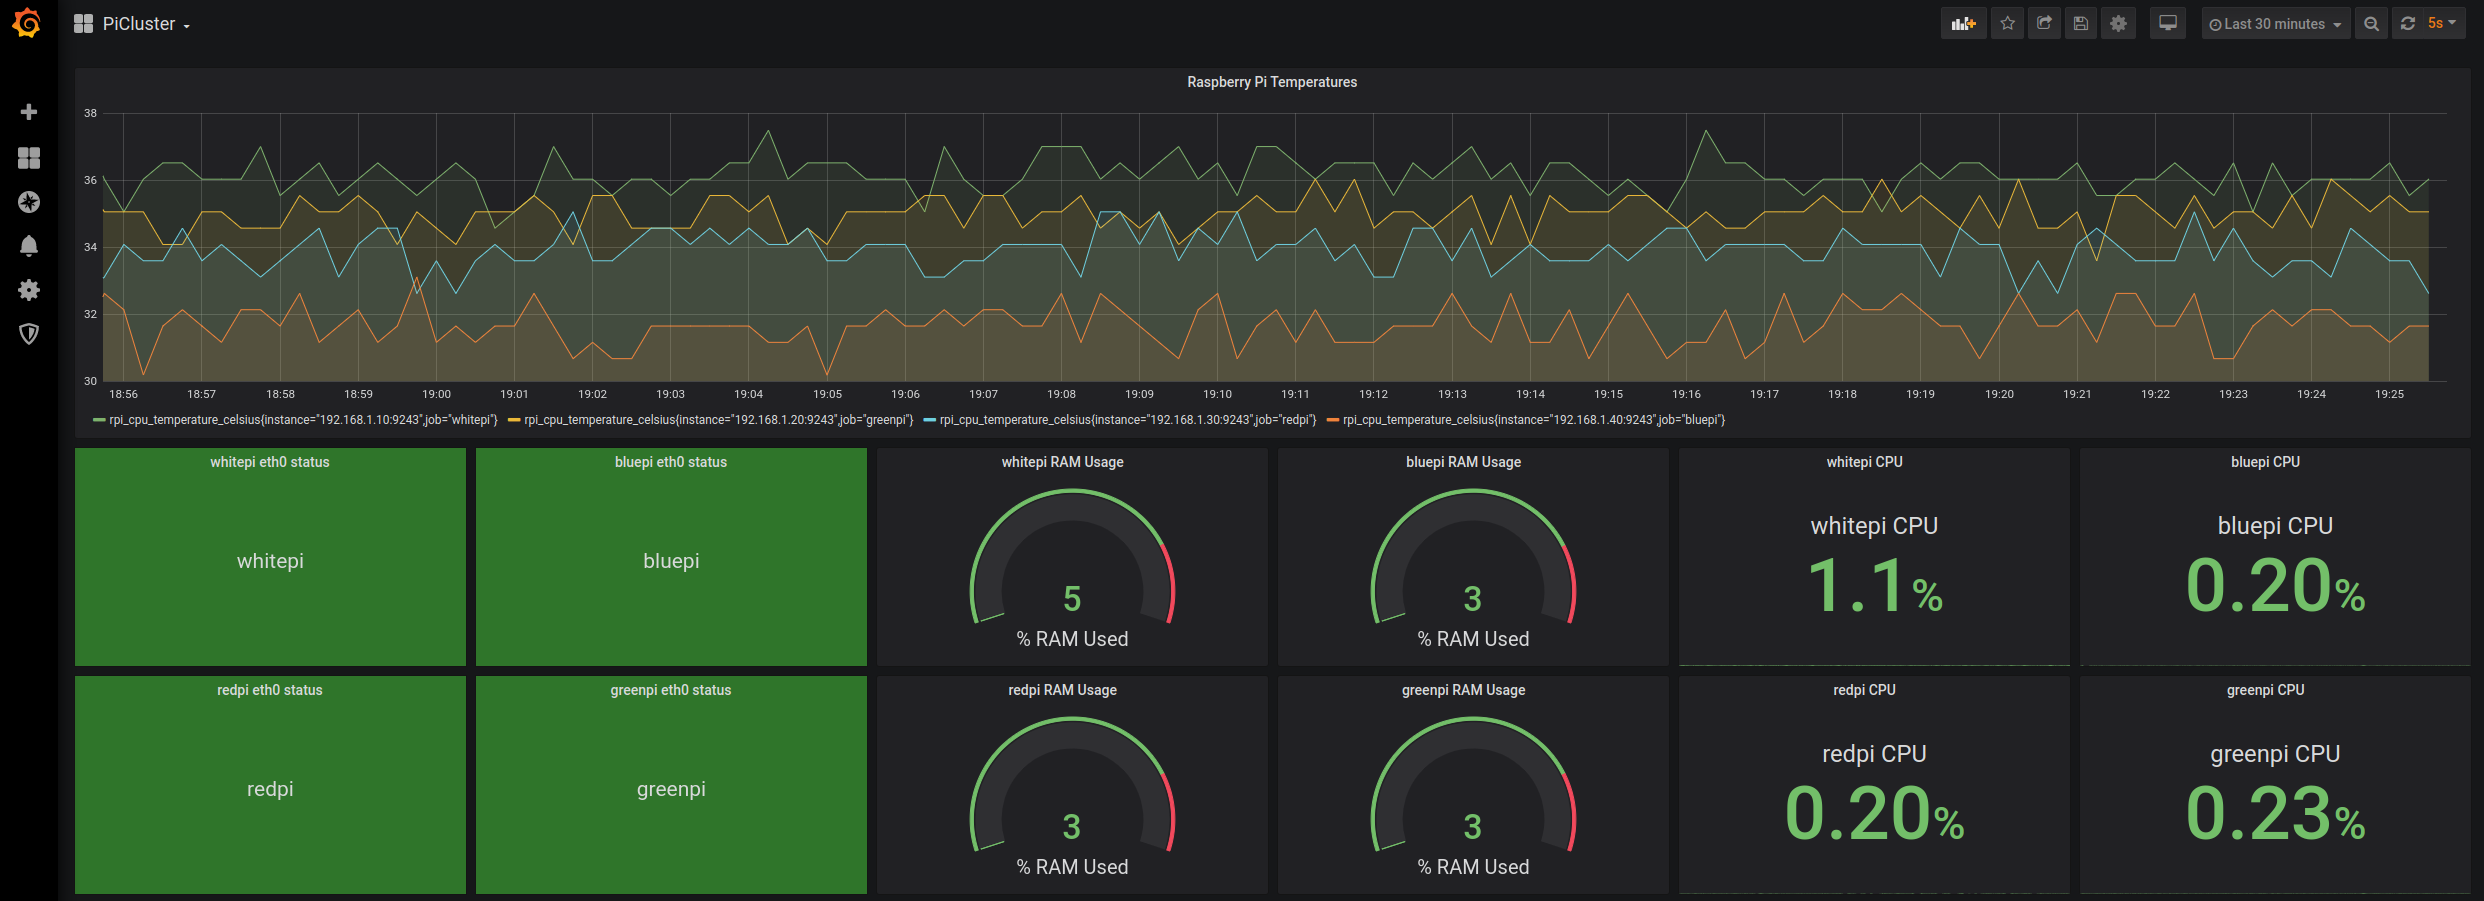
I then created a basic dashboard for my Pi cluster, featuring a graph of the CPU temperature, simple green/red status panel indicators for network status, and some gauges and stats for RAM and CPU usage. I won’t go into much detail about each step I took in configuring my basic Pi Cluster dashboard, you can find the exported JSON dashboard here. I am using the Status Panel plugin for the… status panel.
Gist of my Grafana dashboard exported JSON: https://gist.github.com/dinofizz/af7e62adffea86419aad4d05188bb3eb
Some early temperature analysis
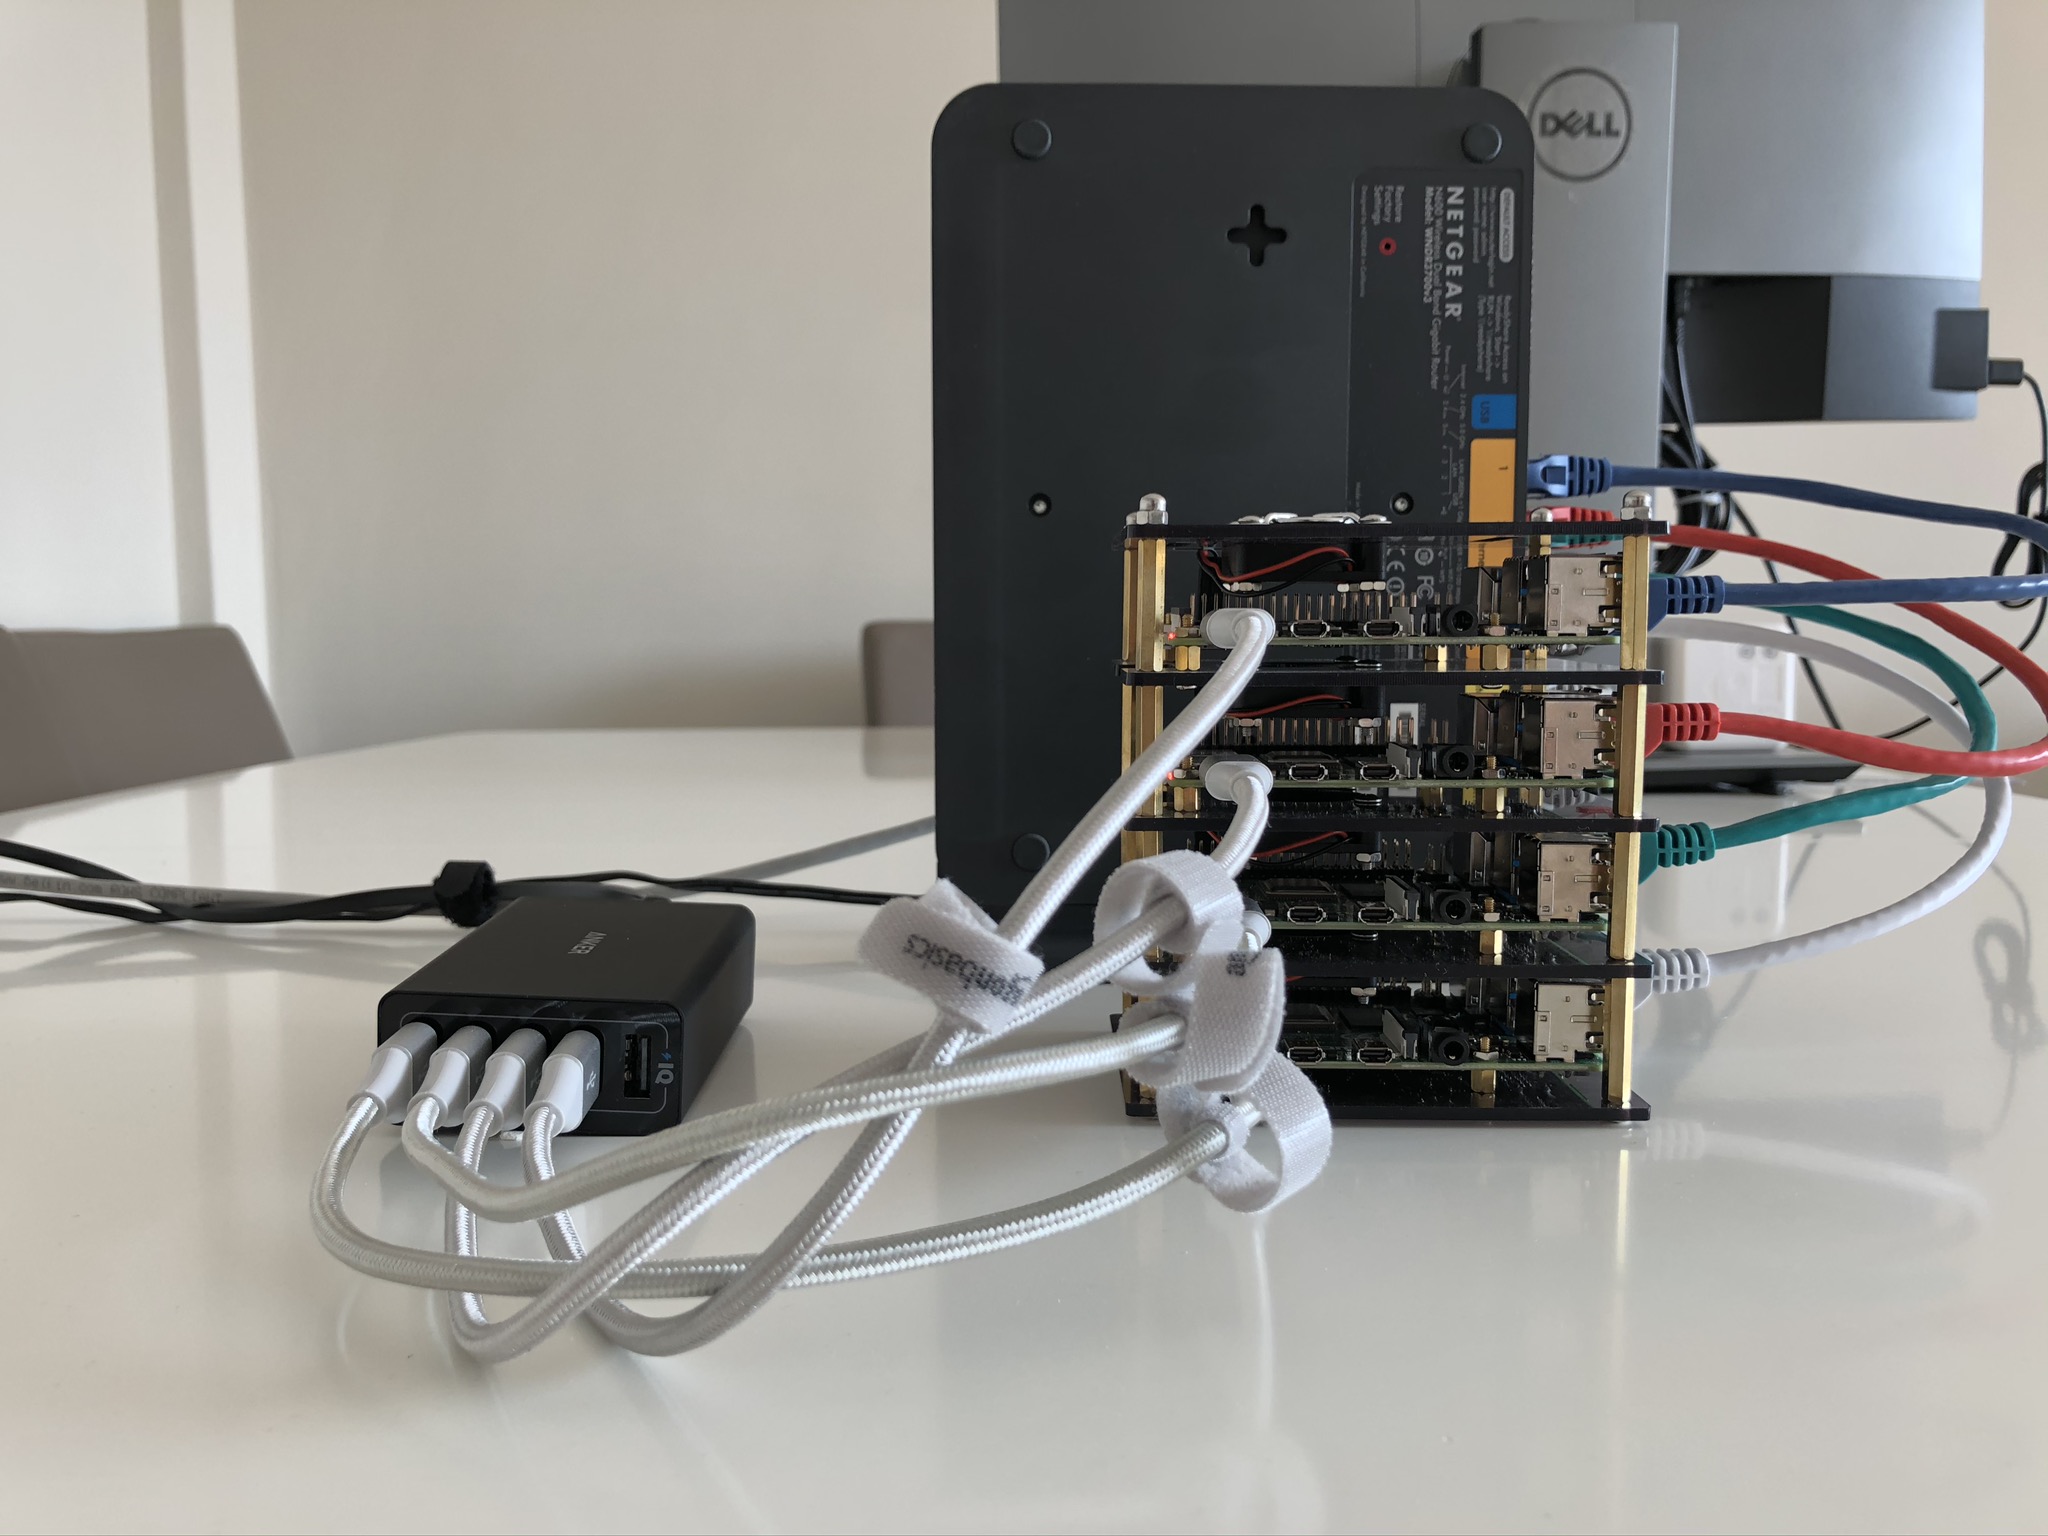
It’s quite easy to see that the Pi CPU temperatures are a function of their vertical position in the cluster case. The boards are stacked like this from top to bottom:
- bluepi
- redpi
- greenpi
- whitepi
The temperatures from coolest to warmest, rounded to the nearest degree and averaged over the previous hour are:
- bluepi : 32°C
- redpi : 34°C
- greenpi : 35°C
- whitepi : 36°C
The whitepi host is running Prometheus and Grafana. The only other software running on all the boards other than the OS is the exporter tools.
I’m guessing that the fans are pulling the warm air from the board above and pushing it down on to the CPU below, with a bit of a cumulative effect. In another post I may explore what happens if I disable the fans, but for that I have to take apart the cluster case.
Conclusion
Well not a real conclusion - this was just the beginning. Now that I have the hardware up and running along with some monitoring software, I can start to run more complex tasks on the cluster and track temperatures and system resources as I go. Next I will be forming a Kubernetes cluster from these Pi hosts, and installing some more interesting services.