In this post I go over how I set up my Kubernetes cluster across four Raspberry Pi 4 nodes using k3s, configured persistent storage using NFS, and then installed a simple “todo” API into the cluster using Helm.
Kubernetes on Raspberry Pi with k3s
The installation and configuration of a Raspberry Pi cluster running Kubernetes has been blogged about many times, and has become easier and simpler to do with newer tools. Much respect and recognition must go to Alex Ellis, who has been creating great content on this topic for a few years now. It is impossible to build a Pi Cluster and not have at least one browser tab open on an Alex Ellis blog post. Alex is responsible for the OpenFaaS project as well as great tools for working with Kubernetes and k3s: k3sup, inlets, arkade to name a few.
While it is possible to set-up a Kubernetes Raspberry Pi cluster with the kubeadm tool included as part of the official Kubernetes distribution, there is an alternative: k3s.
k3s is a light-weight, certified Kubernetes distribution by Rancher Labs targeting Internet of Things (IoT) and edge computing. It provides all the core features and functionality that is required by Kubernetes, but has stripped out alpha features and certain storage drivers and swapped out the cluster etcd key-value store for a SQLite database. This results in the entire distribution being available as single 40 MB download (although some container images will be pulled during set-up), requiring just 512 MB of RAM to run.
Installing k3s
For the next steps I needed to know the IP addresses of each Pi in my cluster. Previously I used my router to set static IP addresses for each Pi:
- 192.168.1.10 - whitepi
- 192.168.1.20 - greenpi
- 192.168.1.30 - redpi
- 192.168.1.40 - bluepi
I will be using whitepi as the k3s server node. If you are following these steps remember that you will also need to make sure that your SSH key has been copied to each of the nodes. I did this as part of my previous post.
For many of the following sections I use the kubectl tool to interact with the cluster once it has been set up.
Install k3sup
I’m using Alex Ellis’ brilliant k3sup tool to set-up my k3s on my Pi cluster. I downloaded and installed the k3sup tool on to my laptop with:
$ curl -sLS https://get.k3sup.dev | sh `sudo install k3sup /usr/local/bin/`
To check if it installed correctly you can run:
$ k3sup version
 _    _____
| | _|___ / ___ _   _ _ __
| |/ / |_ \/ __| | | | '_ \
|   < ___) \__ \ |_| | |_) |
|_|\_\____/|___/\__,_| .__/
                     |_|
Version: 0.9.2
Git Commit: 5a636dba10e1f8e6bb4bb5982c6e04fc21c34534
Set-up the server node
To configure whitepi (192.168.1.10) as the k3s server node using k3sup, I ran:
export SERVER_IP=192.168.1.10
k3sup install --ip $SERVER_IP --user pi --no-extras
Note: I specified the --no-extras flag because by default k3s will install it’s own LoadBalancer, and I will by using the MetalLB load balancer.
At the end of this operation k3sup prints out some useful information to test access to the cluster:
# Test your cluster with:
export KUBECONFIG=/home/dinofizz/kubeconfig
kubectl get node -o wide
Following these instructions shows me that my master node is running as expected (I omitted the wide option so it would fit better in this post):
$ export KUBECONFIG=/home/dinofizz/kubeconfig
$ kubectl get node
NAME      STATUS   ROLES    AGE     VERSION
whitepi   Ready    master   4m12s   v1.17.2+k3s1
Join the agent nodes
Adding nodes to the cluster requires another command…
k3sup join --ip $AGENT_IP --server-ip $SERVER_IP --user pi
…where AGENT_IP is the IP address of each agent to be added to the cluster. A simple bash script to join all my nodes (which took me more time to figure out than to individually type the same command 3 times) can be found below.
#!/bin/bash

SERVER_IP=192.168.1.10
declare -a agents=("192.168.1.20" "192.168.1.30" "192.168.1.40")

for AGENT_IP in ${agents[@]}; do
    k3sup join --ip $AGENT_IP --server-ip $SERVER_IP --user pi
done
Once the above command completed I can run the following command to confirm that all the nodes are present:
$ kubectl
NAME      STATUS   ROLES    AGE   VERSION
whitepi   Ready    master   18m   v1.17.2+k3s1
greenpi   Ready    <none>   12m   v1.17.2+k3s1
redpi     Ready    <none>   12m   v1.17.2+k3s1
bluepi    Ready    <none>   12m   v1.17.2+k3s1
Using my Grafana dashboard I noticed that with k3s running my master node is experiencing about 10% higher CPU usage, and the agent nodes around 1% increase.
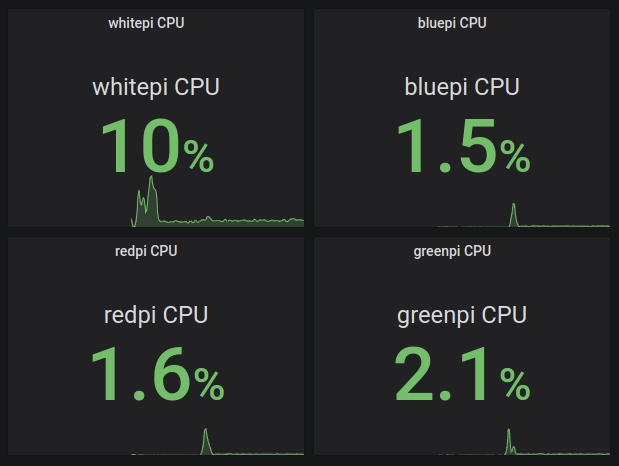
The spikes in the graph occurred when running the k3s commands.
Storage
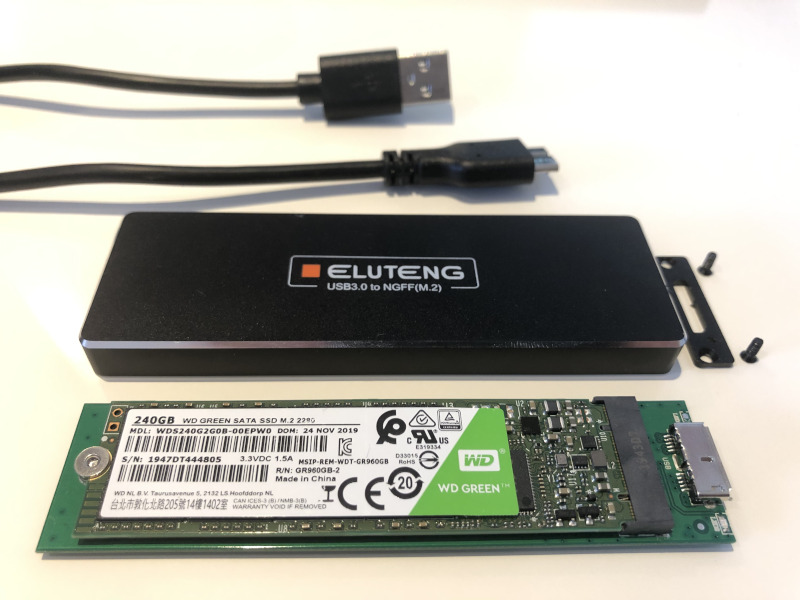
The example “ToDo” application described below requires persistent storage for the database. In a production environment this would be accomplished by using a driver designed and built for distributed storage. In my cluster I am going to keep it simple, by using a portable SSD connected via USB3 and exposed as a Network File System (NFS) share hosted on a single node - the master node. Yes, of course this presents a single point of failure - I lose access to storage if I lose connectivity to master node (or if the master node fails/hangs/crashes). I’m also not sure how this will hold up once I start stressing the system with concurrent reads and writes. For now though, I’m happy to accept this risk for this phase of my learning :)
I wanted something a step up from just a USB flash drive, and so opted for a Western Digital Green M.2 240GB SSD mounted in an Eluteng M.2 external USB3 case.
Instead of listing out all the steps I did, I will provide a link to a post by Grégoire Jeanmart. The relevant section is titled “Configure the SSD disk share”.
I followed his steps exactly, but did make a change to the fstab entries by adding a nofail after the rw option. This prevents the Pi from failing to boot if it does not detect the NFS share. This is what my fstab entry looks like on all my agent nodes (note that 192.168.1.10 is the IP address of my master node which hosts the USB SSD):
proc                    /proc      proc    defaults          0       0
PARTUUID=738a4d67-01    /boot      vfat    defaults          0       2
PARTUUID=738a4d67-02    /          ext4    defaults,noatime  0       1
192.168.1.10:/mnt/ssd   /mnt/ssd   nfs     rw,nofail         0       0
I will admit here that I tried to be very clever and attempted to provision the NFS share into the worker nodes with an Ansible playbook. I unfortunately did not append to the fstab entry and so overwrote it with just the NFS share line. Strangely (I know little about Linux file systems) the Pi still booted up and allowed me to SSH in, but in a “read-only” mode. I popped out the SD card, put it in my laptop and manually edited the /etc/fstab to include the previous partitions by comparing with the entries from another working Pi and the blkid output.
MetalLB
k3s does come with a basic load balancer which uses iptables rules to forward traffic to pods, but I wanted try MetalLB, a “bare-metal load balancer for Kubernetes”. I am using it in the layer 2 configuration, where MetalLB responds to ARP requests with the host MAC address, providing an entry point for traffic into the cluster via an IP address for each service.
Installing MetalLB into the cluster
To install MetalLB into my cluster I copy-pasted the manifest installation instructions from the MetalLB website: https://metallb.universe.tf/installation/#installation-by-manifest
kubectl apply -f https://raw.githubusercontent.com/metallb/metallb/v0.9.3/manifests/namespace.yaml
kubectl apply -f https://raw.githubusercontent.com/metallb/metallb/v0.9.3/manifests/metallb.yaml
kubectl create secret generic -n metallb-system memberlist --from-literal=secretkey="$(openssl rand -base64 128)"
To check that things were installed correctly you can run the command kubectl get pods --all-namespaces:
$ k get pods --all-namespaces
NAMESPACE        NAME                                      READY   STATUS    RESTARTS   AGE
metallb-system   speaker-cshbh                             1/1     Running   2          28h
metallb-system   speaker-dx8qz                             1/1     Running   2          28h
metallb-system   speaker-lqxmk                             1/1     Running   2          28h
kube-system      metrics-server-6d684c7b5-bcrg6            1/1     Running   2          28h
kube-system      local-path-provisioner-58fb86bdfd-pn49b   1/1     Running   2          28h
metallb-system   controller-5c9894b5cd-5xccd               1/1     Running   2          28h
metallb-system   speaker-n7s97                             1/1     Running   2          28h
kube-system      coredns-d798c9dd-xb6ld                    1/1     Running   2          28h
A few new pods were deployed into a new metallb-system namespace: a single “controller” pod deployed as a ReplicaSet, and a “speaker” pod deployed to each node as part of a DaemonSet.
Configure MetalLB for Layer 2 routing
LoadBalancer services won’t work correctly until MetalLB has been configured. I chose the simplest option of the Layer 2 configuration, allowing the load balancer to assign IP addresses from my LAN address space to services in the cluster.
As my current LAN is using addresses in the 192.168.1.x space (aka 192.168.1.0/24), I chose to make the IP address range 192.168.1.240-250 available to MetalLB (I used the exact ConfigMap manifest as from the MetalLB configuration docs).
This can be applied to the cluster in various ways, but I find it easiest to create it from stdin using cat <<EOF | kubectl apply -f - described here, and also used in this YouTube video:
ToDo API
I needed an application to run in my cluster, so I put together a simple ToDo API application written in Go. I’m no expert in Go, in fact this would be my second project in the language (the first being my diskplayer project). I plan on using this API to test various changes to the infrastructure, including changing out my data storage technology and playing with different Kubernetes deployment types and objects: ReplicaSets, StatefulSets, PersistentVolumes, Jobs, etc. If it no longer makes sense to use this simple application, I’ll find something else to install into the cluster to serve my needs.
The ToDo API application exposes a RESTful API, with basic create, retrieve, update and delete functionality. Currently a ToDo resource contains a description and a “completed” boolean flag. There is no authentication. The application currently supports SQLite, MySQL and Mongo databases.
You can find the code for this ToDo API application here: https://github.com/dinofizz/todo-api-go
Installing with Helm
To manage the resources in my k3s cluster I could use kubectl, and run a bunch of commands sequentially (or as part of a script) to install the todo-go application and database. There is however a better way - Helm.
Helm is “the a package manager for Kubernetes”. With Helm you can describe the expected configuration of your application across a group of related Kubernetes resource definitions (yaml files) called a “chart”. Helm can then manage the installation, upgrade and uninstallation of a chart. One great feature using charts for managing Kubernetes resources is that it includes a templating language, and so substitutions for resource names, environment variables, etc. can be done for each new release. Another benefit of using Helm is that the templated values that are inserted into the resources can be arranged in a hierarchy, allowing for different values to be used for different environments, i.e. dev/staging/production.
Helm does not need to be installed into the cluster itself, it is installed on my laptop that I am using to manage the cluster “remotely”. Helm’s website offers various options for installation. I downloaded the latest release an moved it into my /usr/local/bin:
curl -LO https://get.helm.sh/helm-v3.1.3-linux-amd64.tar.gz
tar -xf helm-v3.1.3-linux-amd64.tar.gz
chmod +x helm
sudo mv helm /usr/local/bin/helm
Chart Overview
The helm chart is included in the source repository for the ToDo API application under the todo folder: https://github.com/dinofizz/todo-api-go
The following Helm chart files define the components of my ToDo application resources:
todo/values.yaml
This file contains the properties which are included in the various template files. It specifies the Docker repository and version of the ToDo app, as well as some application configuration values such as the hostname and port and the database to be used.
This default values.yml is applied automatically, but it is possible to override specific values by appending one or more values files to the helm install command. For example, by default the chart will start the ToDo application with a SQLite database accessed via a volume mount to the NFS share. By modifying the helm install command with an additional -f values-mysql.yaml argument, the database connection string will be pulled from this latter values file, overriding the SQLite connection string in the original values.yml. This change will be demonstrated in a later blog post.
todo/templates/deployment.yaml
This file specifies the container image that should be deployed to a pod, as well as how many running instances (pods) should be expected. In addition to some Kubernetes-specific properties, the container image specification has fields similar to the arguments of a docker run command: it details the image repository:version, exposes specific ports, sets the environment variables and lists the volume mounts that should be applied.
Some of the values for the deployment properties are defined in the values.yaml file - typically the values that may change as I play with the environment.
The number of desired running instances for this deployment is given in the replicas property towards the top of the file, whose value is defined in values.yaml.
todo/templates/service.yaml
This file specifies how the ToDo API is accessible from outside the cluster. I have specified a service of type “LoadBalancer”, which means that traffic to the ToDo app will be routed via the MetalLB load balancer (see below). MetalLB will assign an IP address from a pre-defined pool to any service that depends on it, making it really easy for devices on the network to communicate with the services.
Helm Install
I first created a new namespace within my Kubernetes cluster with:
$ kubectl create namespace todo
I then installed the ToDo chart into the cluster by running the following command from my project folder:
$ helm install --namespace todo todo-api todo/
The chart is given the name “todo-api”, and a single pod (ReplicaSet with 1 replica) is installed:
$ kubectl --namespace todo get pods
NAME                        READY   STATUS    RESTARTS   AGE
todo-api-6748857db6-p4lcv   1/1     Running   0          2m31s
Testing the ToDo API
The ToDo API is accessible via an IP address provided by the LoadBalancer:
$ kubectl get service --namespace todo
NAME       TYPE           CLUSTER-IP     EXTERNAL-IP     PORT(S)        AGE
todo-api   LoadBalancer   10.43.70.248   192.168.1.240   80:31354/TCP   7m11s
This shows that the service is available on the network at IP address 192.168.1.240 and port 80.
In the examples below I use curl to issue the HTTP requests and jq to to present a nicely formatted response.
Create
curl -s -H "Content-Type: application\json" \
--request POST \
--data '{"description": "Buy milk", "completed": false}' \
http://192.168.1.240/todo | jq
Which produces the output:
{
  "Id": "1",
  "Description": "Buy milk",
  "Completed": false
}
Retrieve
curl -s http://192.168.1.240/todo/1 | jq
Output:
{
  "Id": "1",
  "Description": "Buy milk",
  "Completed": false
}
Update
curl -s -H "Content-Type: application\json" \
--request PUT \
--data '{"description": "Buy milk", "completed": true}' \
http://192.168.1.240/todo/1 | jq
Output:
{
  "Id": "1",
  "Description": "Buy milk",
  "Completed": true
}
Delete
curl -s --request DELETE http://192.168.1.240/todo/1 | jq
Output:
{
  "result": "success"
}
Playing with Kubernetes
Scaling the ReplicaSet
With the helm chart installed using the default values.yaml a ReplicaSet with 1 replica is deployed (a single pod):
$ kubectl get pods -o wide -n todo
NAME                        READY   STATUS    RESTARTS   AGE   IP           NODE      NOMINATED NODE   READINESS GATES
todo-api-6748857db6-p4lcv   1/1     Running   1          47h   10.42.1.14   greenpi   <none>           <none>
With the above command I can see that the todo-api is running on a pod on the greenpi node.
Let’s see what happens when I increase the ReplicaSet to 12 replicas:
$ kubectl scale deployment --replicas 12 todo-api -n todo
deployment.apps/todo-api scaled
Checking the number of running pods I see 12 pods running the ToDo API, distributed across all the nodes:
$ kubectl get pods -n todo -o custom-columns=NAME:.metadata.name,NODE:.spec.nodeName,Status:.status.phase --sort-by=.spec.nodeName
NAME                        NODE      Status
todo-api-6748857db6-47rww   bluepi    Running
todo-api-6748857db6-5l95g   bluepi    Running
todo-api-6748857db6-t29mm   bluepi    Running
todo-api-6748857db6-z9ctd   greenpi   Running
todo-api-6748857db6-w7w76   greenpi   Running
todo-api-6748857db6-kdq4p   greenpi   Running
todo-api-6748857db6-4fffk   redpi     Running
todo-api-6748857db6-vsvwb   redpi     Running
todo-api-6748857db6-gntck   redpi     Running
todo-api-6748857db6-qvt86   whitepi   Running
todo-api-6748857db6-xmzwk   whitepi   Running
todo-api-6748857db6-j54nd   whitepi   Running
To scale back to a single pod:
$ kubectl scale deployment --replicas 1 todo-api -n todo
deployment.apps/todo-api scaled
And to confirm (I had to wait a few seconds while 11 pods are terminated):
$ kubectl get pods -n todo
NAME                        READY   STATUS    RESTARTS   AGE
todo-api-6748857db6-z9ctd   1/1     Running   0          17m
The Ellis-Hanselman Test
The following presentation by Alex Ellis and Scott Hanselman was a big inspiration to me in building this cluster:
At around 26 minutes 50 seconds into the presentation Alex and Scott begin demonstrating the elastic high availability that is a core feature of Kubernetes. They have a 6 node Pi Cluster running a single instance of an application that blinks a row of LEDs attached to the Pi. The application is running in a pod that belongs to a ReplicaSet which specifies that there should be 1 replica running at all times. Alex then unplugs the network cable from the node running the application. After some time Kubernetes becomes aware that it can no longer communicate with the node running the replica, and spins up a new pod on an available node. When the network cable is plugged back into the first node, Kubernetes terminates the pod to satisfy the requirement for one and only one replica in the ReplicaSet.
Alex mentions in the video that they did have to tweak something to get Kubernetes to accelerate the recognition of a “lost node”. I’m not sure exactly what they tweaked, but I found that there is an “unreachable” toleration which is defaulted to 300 seconds (5 minutes) for pods in the cluster. I noticed that Helm automatically provides for the inclusion of custom defined tolerations in the deployment.yaml added so I the following to my values.yml to drop the timeout to 10 seconds:
tolerations:
  - key: "node.kubernetes.io/unreachable"
    operator: "Exists"
    effect: "NoExecute"
    tolerationSeconds: 10
I wanted to perform the same test but I don’t have any any LEDs attached to my Pi. To observe the changes to the cluster I simply watch the pod events as I unplug a network cable from the node running my pod, wait for a new pod to start running, and then plug network cable back in and watch Kubernetes delete the old pod (just like in Alex and Scott’s test).
My attempt
To start with I make sure that there is nothing currently running in my todo namespace:
$ kubectl get pods -n todo
No resources found in todo namespace.
I then run the kubectl get pods command, but add the -w watch flag so that I can follow changes to the pods in real-time, as well as adding the --output-watch-events flag to view pod-related events. The -o wide argument allows me to see which node the pod is running on. I call the terminal window in which this command is running the “watch” window.
$ kubectl get pods -n todo -w -o wide --output-watch-events
# no output, as nothing is running yet
To kick things off I then install the ToDo API into the todo namespace via the helm chart, by running the following command in a different terminal window from the ToDo API project root folder:
$ helm install --namespace todo todo-api todo/
NAME: todo-api
LAST DEPLOYED: Fri May  8 12:57:34 2020
NAMESPACE: todo
STATUS: deployed
REVISION: 1
NOTES:
1. Get the application URL by running these commands:
     NOTE: It may take a few minutes for the LoadBalancer IP to be available.
           You can watch the status of by running 'kubectl get --namespace todo svc -w todo-api'
  export SERVICE_IP=$(kubectl get svc --namespace todo todo-api --template "{{ range (index .status.loadBalancer.ingress 0) }}{{.}}{{ end }}")
  echo http://$SERVICE_IP:80
After running the install command above I see events logged in the “watch” window:
$ kubectl get pods -n todo -w -o wide --output-watch-events
EVENT      NAME                        READY   STATUS              RESTARTS   AGE    IP           NODE      NOMINATED NODE   READINESS GATES
ADDED      todo-api-78b984d7ff-fnnqg   0/1     Pending             0          0s     <none>       <none>    <none>           <none>
MODIFIED   todo-api-78b984d7ff-fnnqg   0/1     Pending             0          0s     <none>       <none>    <none>           <none>
MODIFIED   todo-api-78b984d7ff-fnnqg   0/1     Pending             0          4s     <none>       bluepi    <none>           <none>
MODIFIED   todo-api-78b984d7ff-fnnqg   0/1     ContainerCreating   0          4s     <none>       bluepi    <none>           <none>
MODIFIED   todo-api-78b984d7ff-fnnqg   1/1     Running             0          8s     10.42.3.42   bluepi    <none>           <none>
From the watch window output we can see that Kubernetes added a pod into the namespace, and through a series of “modifications” scheduled it to run on the bluepi node. The container image was pulled and eventually the pod resolved to a running state.
I then pull out the Ethernet cable from the bluepi node (which is easy to identify as I’ve labelled the nodes according to the colour of the Ethernet cable connected to the router):
...
MODIFIED   todo-api-78b984d7ff-fnnqg   1/1     Running             0          82s    10.42.3.42   bluepi    <none>           <none>
MODIFIED   todo-api-78b984d7ff-fnnqg   1/1     Terminating         0          97s    10.42.3.42   bluepi    <none>           <none>
ADDED      todo-api-78b984d7ff-r8649   0/1     Pending             0          0s     <none>       <none>    <none>           <none>
MODIFIED   todo-api-78b984d7ff-r8649   0/1     Pending             0          0s     <none>       greenpi   <none>           <none>
MODIFIED   todo-api-78b984d7ff-r8649   0/1     ContainerCreating   0          0s     <none>       greenpi   <none>           <none>
MODIFIED   todo-api-78b984d7ff-r8649   1/1     Running             0          4s     10.42.1.31   greenpi   <none>           <none>
After some time Kubernetes realises that bluepi is unreachable. It is unsure of the status of the pod running on that node, and decides to terminate the pod running on bluepi. To maintain the ReplicaSet count of 1 replica it schedules a new pod to be added to the namespace on a new node - this time on greenpi.
Once the new pod on greenpi is in a running state, I then re-attach the network cable to bluepi:
...
MODIFIED   todo-api-78b984d7ff-fnnqg   1/1     Terminating         0          2m     10.42.3.42   bluepi    <none>           <none>
MODIFIED   todo-api-78b984d7ff-fnnqg   0/1     Terminating         0          2m1s   10.42.3.42   bluepi    <none>           <none>
MODIFIED   todo-api-78b984d7ff-fnnqg   0/1     Terminating         0          2m2s   10.42.3.42   bluepi    <none>           <none>
DELETED    todo-api-78b984d7ff-fnnqg   0/1     Terminating         0          2m2s   10.42.3.42   bluepi    <none>           <none>
Above we see that Kubernetes was able to resume communication with the node after the network cable was re-attached. It was then able to completely follow through on the earlier “terminate” event. After a series of pod modification events we see that we end up with the original pod on bluepi “DELETED”.
To confirm the final state of the helm release in the cluster:
$ kubectl get pods -n todo
NAME                        READY   STATUS    RESTARTS   AGE   IP           NODE      NOMINATED NODE   READINESS GATES
todo-api-78b984d7ff-v7m6v   1/1     Running   0          3m    10.42.1.33   greenpi   <none>           <none>
And there we see that we have a single pod running on greenpi, just as we expected from a deployment with a ReplicaSet with 1 replica.
Conclusion
I really learnt a great deal about running Kubernetes on a Raspberry Pi. k3s makes things really easy to set-up and helm makes it really easy to deploy applications into the cluster. I’m now really excited to move forward and begin experimenting with scale, storage and other features of Kubernetes.