This post details how I used a Python based load test framework (Locust) to perform some simple tests on an HTTP API application using Kubernetes in my Raspberry Pi Cluster.
Introduction
This is Part 3 in a series of posts (Part 1, Part 2) related to my Raspberry Pi cluster. In this post I detail how I ran a series of load tests against my simple ToDo API running in Kubernetes.
Note: The objective of this post is not to explain how to write magnificent and very appropriate performance tests for your API. I am also not too concerned about in-depth analysis of the results (although I do comment on some of the observations). This is all about me learning how to run things in Kubernetes, playing with different deployment patterns and getting a feel for writing test code using Locust.
Current Cluster Configuration
My current cluster has the following configuration:
- 4x Raspberry Pi 4 Model B 4GB nodes
- Each node runs as part of a Kubernetes cluster implemented using k3s
- Persistent storage available via a Network File Storage (NFS) share, hosted on the k3s coordinator node
For more details, see my previous posts.
Locust
Locust is an open source load testing tool which allows you to write your performance tests in Python code. Test runs can be headless, or controlled via a simple web UI and it has the ability to run in a distributed mode, with multiple worker nodes controlled by a coordinator node. The core Python classes are extensible, allowing one to provide custom implementations for specific web protocols and traffic patterns.
Load test
The goal for this post is to run Locust in a distributed manner, targeting my simple ToDo API running in Kubernetes on my Pi Cluster. My simple example of a load test for my ToDo API application performs the following CRUD activities:
- Create a ToDo item with a random description and a completion status set to “false”.
- Retrieve the ToDo item that was created in the first step.
- Update the ToDo item with a completion status set to “true.
- Delete the ToDo item.
Is this a great performance test? Not really, I don’t think this sequence of events represents meaningful user behaviour. But it should do OK for my purposes of demonstrating Locust running in my cluster - and maybe even gain some insight into the ToDo API performance.
The entirety of the Locust code is specified in a single locustfile.py:
import lorem
from locust import HttpUser, task, between, SequentialTaskSet


class TodoUser(HttpUser):
    wait_time = between(2, 5)
    todo_item = None

    @task
    class CrudSequence(SequentialTaskSet):
        @task
        def create_todo(self):
            headers = {"content-type": "application/json"}
            response = self.client.post(
                "/todo",
                json={"Description": lorem.sentence(), "Completed": False},
                headers=headers,
            )
            self.user.todo_item = response.json()

        @task
        def retrieve_todo(self):
            self.client.get(f"/todo/{self.user.todo_item['Id']}", name="/todo/[id]")

        @task
        def update_todo(self):
            headers = {"content-type": "application/json"}
            self.user.todo_item["Completed"] = True
            self.client.put(
                f"/todo/{self.user.todo_item['Id']}",
                json=self.user.todo_item,
                headers=headers,
                name="/todo/[id]"
            )

        @task
        def delete_todo(self):
            self.client.delete(f"/todo/{self.user.todo_item['Id']}", name="/todo/[id]")
The repository for my Locust code and accompanying Helm chart is here: https://github.com/dinofizz/locust-todo
Helm chart
To facilitate the installation of the Locust coordinator and worker nodes into my cluster I am using a Helm chart (you can read my own overview of Helm here). There does exist an existing Locust Helm chart within the official Helm repository, but it is currently referencing an older version of Locust which uses different configuration environment variables than the latest (v1.0.1) that I wish to use.
So I created my own Helm chart with the following features:
- Locust runtime parameters are specified via environment variables, configurable from the
values.yml. - Locust workers can be deployed as either a DaemonSet or as a Deployment with a configurable number of replicas.
- The former guarantees each node will run a single worker pod.
- The latter allows for the scheduler to run multiple replica worker pods per node.
- The reason for providing for both configurations is solely for my own interest in learning to work with different deployment models.
- ARM-compatible Locust image (see below).
Locust Docker build for ARM
Kubernetes sources the container images from the repository specified in the values.yaml file. Ideally I should be able to just point to the official Locust repository “locustio/locust”, install my Helm chart and run my load tests. Unfortunately the Locust Docker Hub repository does not provide images built to run on the ARM architecture, and thus they will not run on my Raspberry Pi cluster. If you attempt to run an image built for x86 on an ARM device this you will most likely see an error message displaying something like exec user process caused "exec format error".
To solve this problem I cloned the Locust GitHub repository and used Docker’s buildx tool to create a multi-architecture image which I then pushed to my own Docker Hub repository. No changes to the Locust code or the existing Dockerfile were required.
Running Locust in the Cluster as a DaemonSet
The first configuration I wanted to work with was to run a single Locust coordinator pod on my k3s coordinator node, and distribute the worker pods as a DaemonSet across the other nodes.
Node labels and nodeSelector
To ensure that the Locust coordinator runs on my k3s coordinator node (“whitepi”) I label the node accordingly with:
kubectl label nodes whitepi locustRole=coordinator
This is specified in the coordinator-deployment.yaml template:
...
nodeSelector:
  locustRole: coordinator
...
Likewise the remaining nodes are labelled as worker nodes:
kubectl label nodes greenpi locustRole=worker
kubectl label nodes bluepi locustRole=worker
kubectl label nodes redpi locustRole=worker
And the worker.yaml file specifies the following nodeSelector:
...
nodeSelector:
  locustRole: worker
...
Helm Chart Install
To run Locust in with the DaemonSet configuration the workers.kind property in the chart values.yaml should be set to DaemonSet:
...
workers:
  kind: Daemonset
...
I decided to create a new namespace for the Locust pods, in addition to the existing “todo” namespace I created previously.
kubectl create namespace locust
The chart can then be installed with the following command:
$ helm install --namespace locust locustchart --generate-name
NAME: locustchart-1590923674
LAST DEPLOYED: Sun May 31 12:14:34 2020
NAMESPACE: locust
STATUS: deployed
REVISION: 1
NOTES:
1. Get the application URL by running these commands:
     NOTE: It may take a few minutes for the LoadBalancer IP to be available.
           You can watch the status of by running 'kubectl get --namespace locust svc -w locustchart-1590923674-locust'
  export SERVICE_IP=$(kubectl get svc --namespace locust locustchart-1590923674-coordinator-service-web --template "{{ range (index .status.loadBalancer.ingress 0) }}{{.}}{{ end }}")
  echo http://$SERVICE_IP:80
To find the IP address to which the LoadBalancer has assigned the service I run the commands as described above:
$ export SERVICE_IP=$(kubectl get svc --namespace locust locustchart-1590923674-coordinator-service-web --template "{{ range (index .status.loadBalancer.ingress 0) }}{{.}}{{ end }}")
$ echo http://SERVICE_IP:80
http://192.168.0.241:80
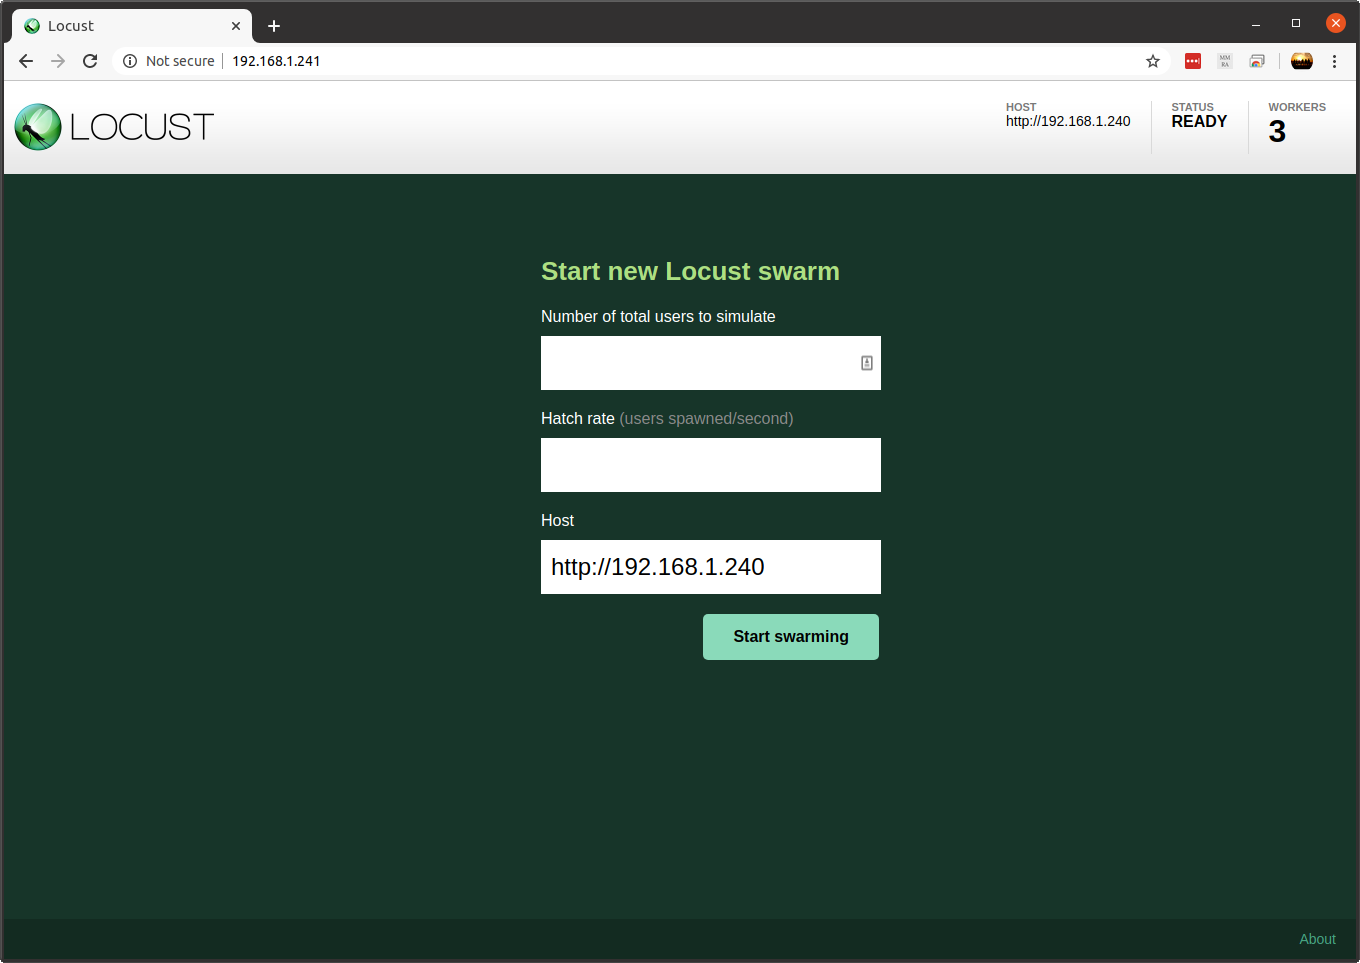
Visiting this address in the browser I am presented with the Locust web UI running on the Locust coordinator and confirming that there are 3 workers connected:
Tests with SQLite Database
For the first set of tests I will be running the ToDo API with the default Helm chart settings. This creates a Deployment with a single replica of the API instance, using SQLite as a database. The SQLite file is hosted on the k3s coordinator node and made available to other nodes using a Persistent Volume bound to the NFS mount. This setup was described in my previous blog post.
To install the chart run the following command from the ToDo API project root which installs the ToDo API application in the “todo” namespace.
$ helm install --namespace todo todo-sqlite todo/
SQLite database with 1x ToDo API, 3x Locust workers and 200 users
Using the Locust web UI I created a test targeting 200 users with a hatch rate of 10 users spawned per second.
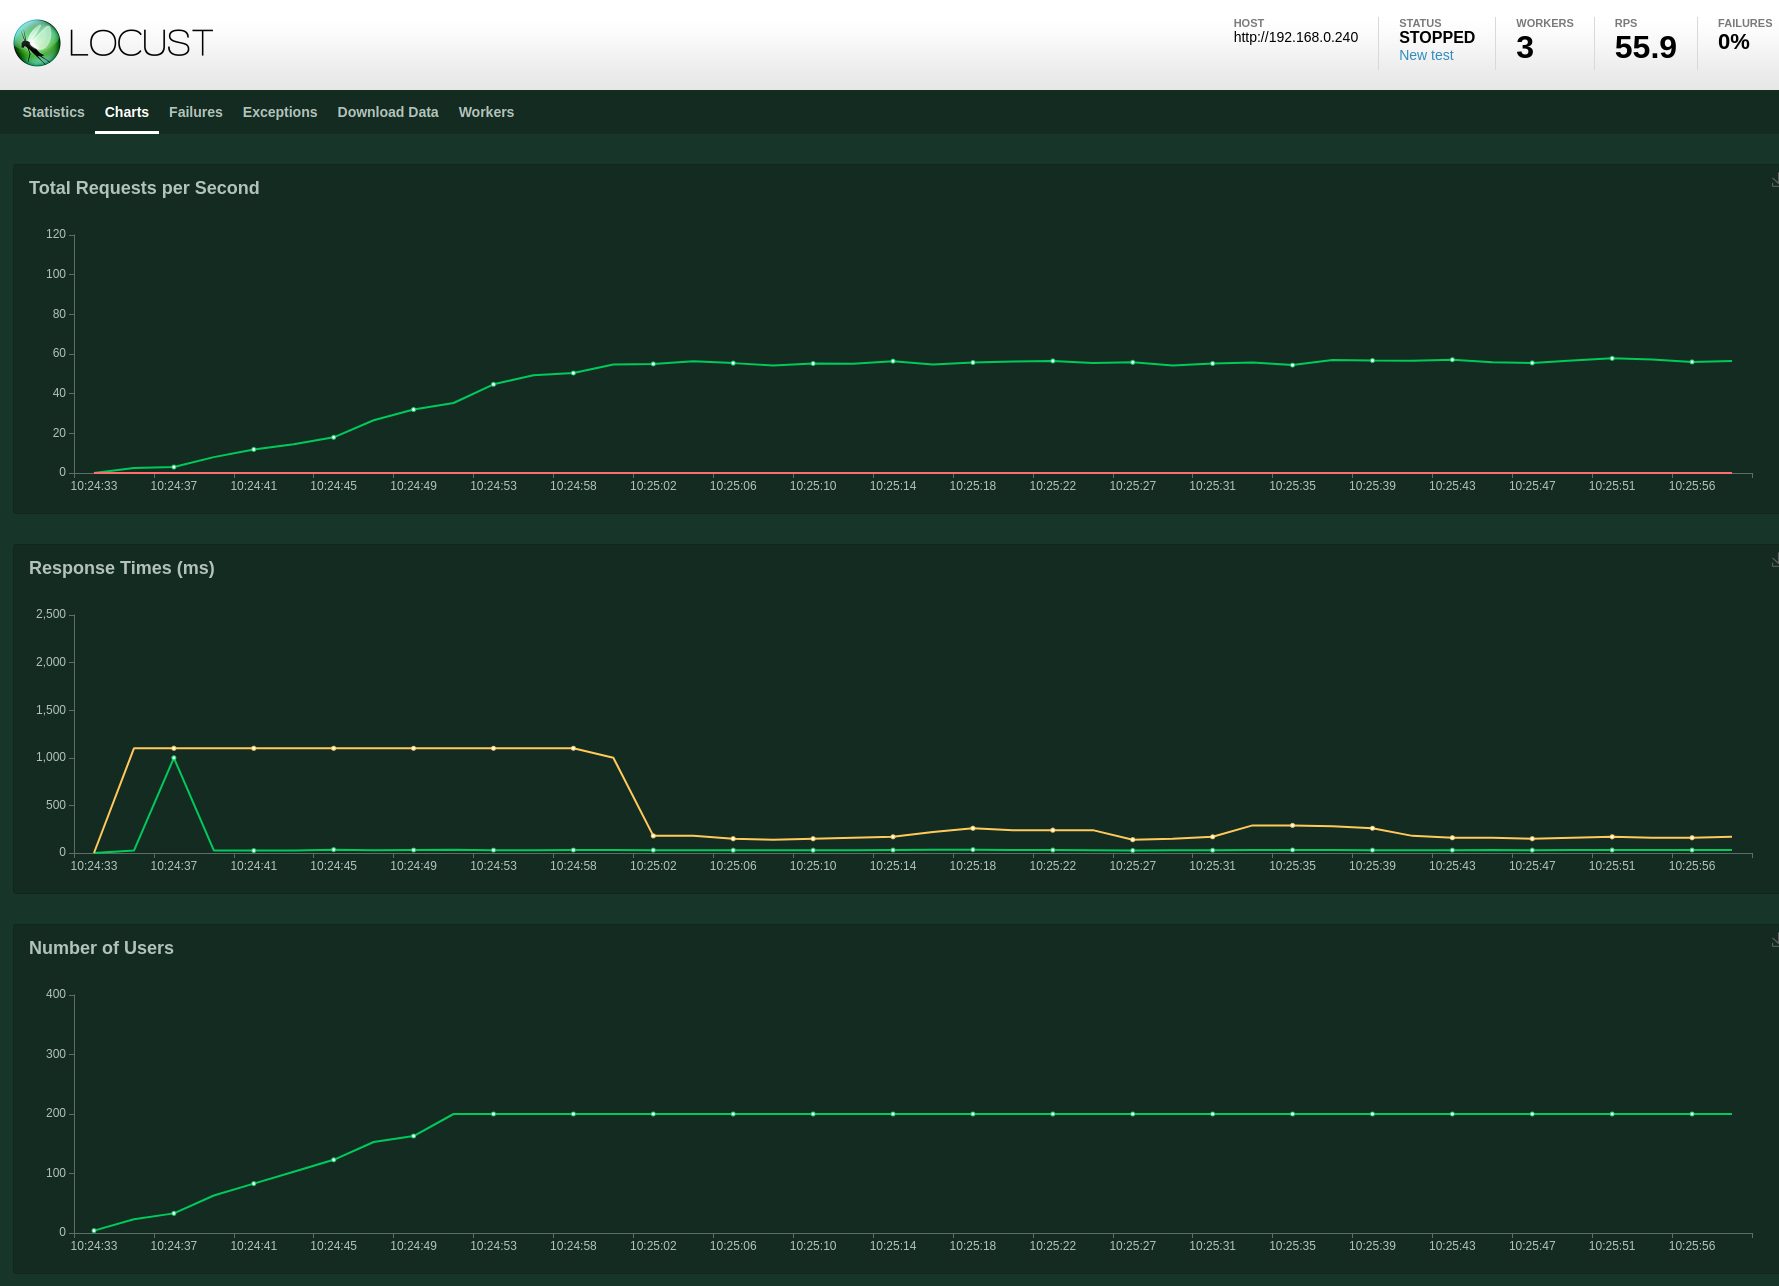
With a single ToDo API instance and the SQLite database it is able to sustain around 56 requests per second with 0 failures. There is an initial spike in response latency which settles fairly quickly.
SQLite database with 1x ToDo API, 3x Locust workers and 400 users
For the next test I only changed the total number of users, increasing it to 400. In the screenshot below I have kept the previous test result to aid comparison.
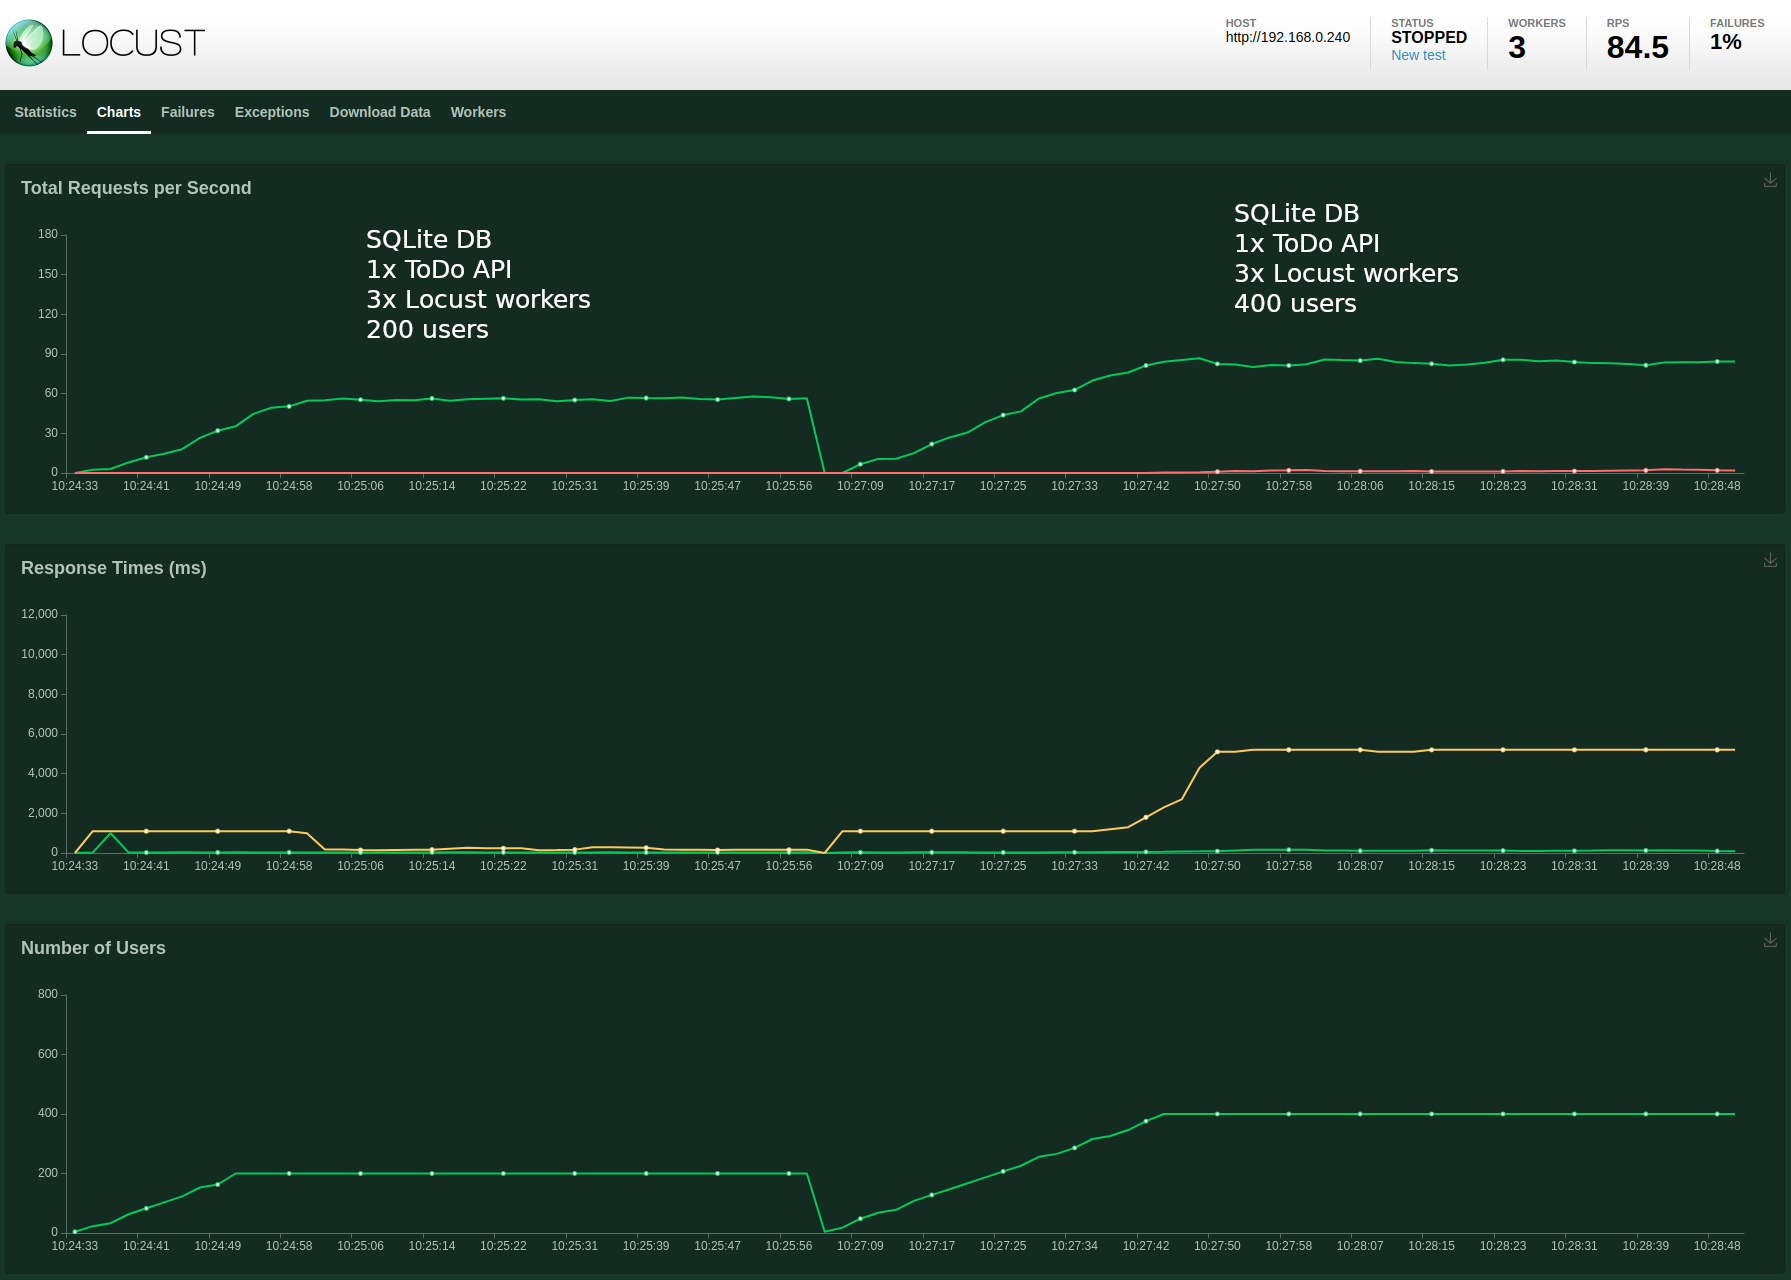
While the requests per second (RPS) have increased to 84.5 we observe an error rate of around 1%, and horrible median response times of around 6 seconds. Checking the Locust “Failures” tab shows the following (click to view the original image):
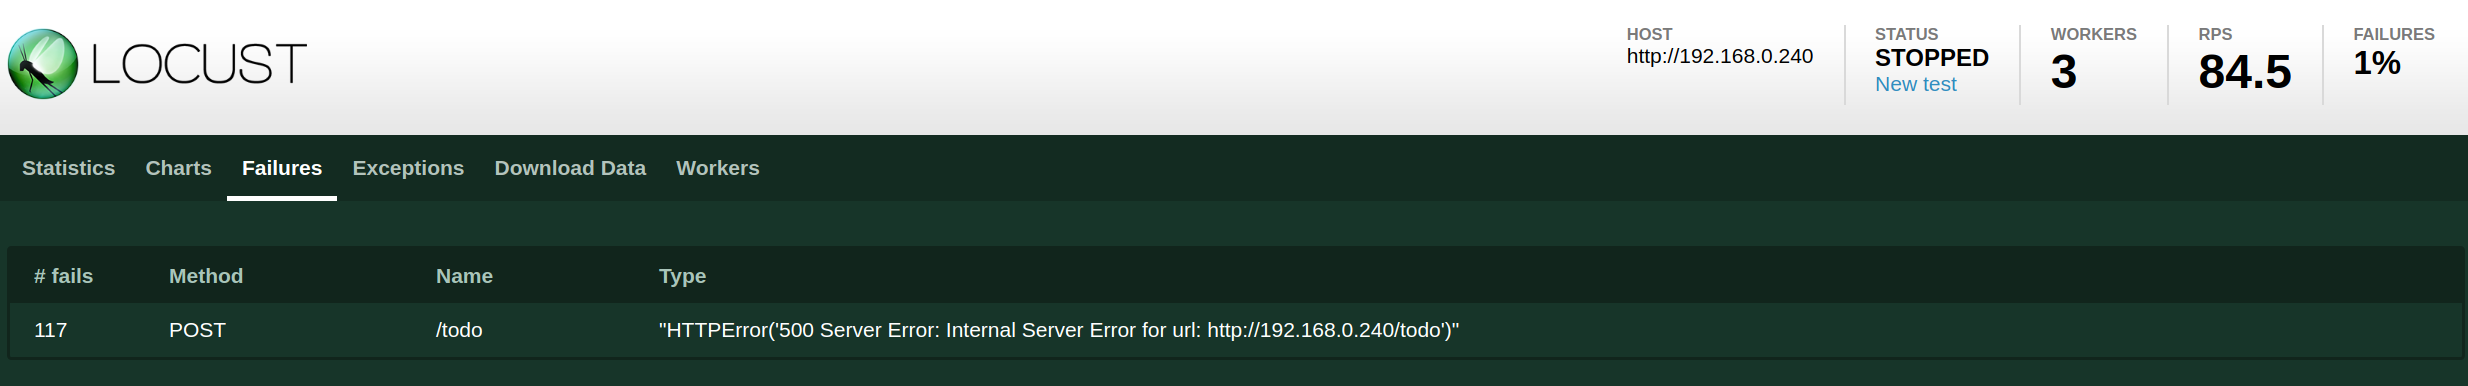
So this tells us that we received HTTP responses with a 500 code. Using kubectl I can check the logs for the ToDo API container:
$ kubectl --namespace todo logs todo-sqlite-58f5895cb8-hj79z
...
(/app/gormdb.go:52)
[2020-06-28 09:28:19]  database is locked

(/app/gormdb.go:34)
[2020-06-28 09:28:19]  database is locked

(/app/gormdb.go:67)
[2020-06-28 09:28:19]  database is locked

(/app/gormdb.go:34)
[2020-06-28 09:28:19]  database is locked

(/app/gormdb.go:52)
[2020-06-28 09:28:19]  database is locked

(/app/gormdb.go:52)
[2020-06-28 09:28:19]  database is locked

(/app/gormdb.go:52)
[2020-06-28 09:28:20]  database is locked

(/app/gormdb.go:67)
[2020-06-28 09:28:20]  database is locked

(/app/gormdb.go:52)
[2020-06-28 09:28:20]  database is locked
...
By increasing the requests per second to the API we have also increased the requests to the SQLite database, which was not really designed to handle concurrent access.
SQLite database with 3x ToDo API, 3x Locust workers and 400 users
It would be erroneous to think that by scaling out the number of ToDo API instances that we would somehow reduce the error rate and improve performance. But let’s try it anyway.
I increased the number of ToDo API replicas from 1 to 3 using the following command:
kubectl --namespace todo scale deployment todo-sqlite --replicas 3
Confirm by checking the pods:
$ kubectl --namespace todo get pods
NAME                           READY   STATUS    RESTARTS   AGE
todo-sqlite-58f5895cb8-hj79z   1/1     Running   0          2d1h
todo-sqlite-58f5895cb8-jpnt7   1/1     Running   0          43s
todo-sqlite-58f5895cb8-nz8j4   1/1     Running   0          43s
I than re-ran the test with the same parameters as before:

Now I have an increased error rate and reduced requests per second. Checking the logs I see:
$ kubectl --namespace todo logs todo-sqlite-58f5895cb8-nz8j4
...
(/app/gormdb.go:67)
[2020-06-28 09:37:38]  database is locked

(/app/gormdb.go:52)
[2020-06-28 09:37:39]  database is locked

(/app/gormdb.go:34)
[2020-06-28 09:37:39]  database is locked

(/app/gormdb.go:52)
[2020-06-28 09:37:39]  disk I/O error

(/app/gormdb.go:52)
[2020-06-28 09:37:39]  database is locked

(/app/gormdb.go:34)
[2020-06-28 09:37:39]  database is locked

(/app/gormdb.go:34)
[2020-06-28 09:37:41]  database is locked
...
So in addition to the database access errors, I also experience disk errors. The SQLite database is a single file now being shared using NFS to multiple hosts, and the file system is not enjoying keeping up with the constant reads and writes happening across the 3 ToDo API containers.
SQLite might not be a great database to use at scale with multiple clients requiring concurrent access.
Tests with MySQL Database
It’s a good thing then that the ToDo API application code and the Helm charts within the project repository make it really easy to swap SQLite out for MySQL.
First I uninstalled the existing chart:
$ helm --namespace todo uninstall todo-sqlite
release "todo-sqlite" uninstalled
I then need to create a Kubernetes secret which stores the MySQL database password. The MySQL deployment will extract the password from the secret and inject it into an environment variable in the container. Yes, I’m using “password” for my password:
kubectl --namespace todo create secret generic mysql-password-secret --from-literal=password='password'
I then install the MySQL chart, which creates a pod running MySQL. It uses a Persistent Volume and Persistent Volume Claim to appropriate a portion of the NFS share for persistent storage of the database files.
helm --namespace todo install mysql ./mysql
Once the database pod is running I need to run a shell in the container to create the database (I haven’t automated this yet, but I should):
$ kubectl --namespace todo exec -it mysql-8657db9f5f-rcgfd -- bash
root@mysql-8657db9f5f-rcgfd:/# mysql -p
Enter password:
Welcome to the MySQL monitor.  Commands end with ; or \g.
Your MySQL connection id is 8
Server version: 5.5.60-0+deb7u1 (Debian)

Copyright (c) 2000, 2018, Oracle and/or its affiliates. All rights reserved.

Oracle is a registered trademark of Oracle Corporation and/or its
affiliates. Other names may be trademarks of their respective
owners.

Type 'help;' or '\h' for help. Type '\c' to clear the current input statement.

mysql> create database todo;
Query OK, 1 row affected (0.00 sec)

mysql> quit;
Bye
root@mysql-8657db9f5f-rcgfd:/#
I can now re-install the ToDo API into the cluster. This time also I specify an additional values file which contains the MySQL configuration options using the -f command line parameter:
$ helm --namespace todo install todo-mysql ./todo -f todo/values-mysql.yaml
NAME: todo-mysql
LAST DEPLOYED: Sun Jun 28 10:45:26 2020
NAMESPACE: todo
STATUS: deployed
REVISION: 1
NOTES:
1. Get the application URL by running these commands:
     NOTE: It may take a few minutes for the LoadBalancer IP to be available.
           You can watch the status of by running 'kubectl get --namespace todo svc -w todo-mysql'
  export SERVICE_IP=$(kubectl get svc --namespace todo todo-mysql --template "{{ range (index .status.loadBalancer.ingress 0) }}{{.}}{{ end }}")
  echo http://$SERVICE_IP:80
Checking the pods in “todo” I find everything to be running as expected:
$ kubectl --namespace todo get pods
NAME                          READY   STATUS    RESTARTS   AGE
mysql-8657db9f5f-rcgfd        1/1     Running   0          10m
todo-mysql-5cff685dcb-6jhxj   1/1     Running   0          7m3s
Now I am ready to run some more tests.
MySQL database with 1x ToDo API, 3x Locust workers and 400 users
I decided to start with a single ToDo API instance and 400 users. With the previous SQLite configuration I was seeing RPS of 84.5 and an error rate of 1%.
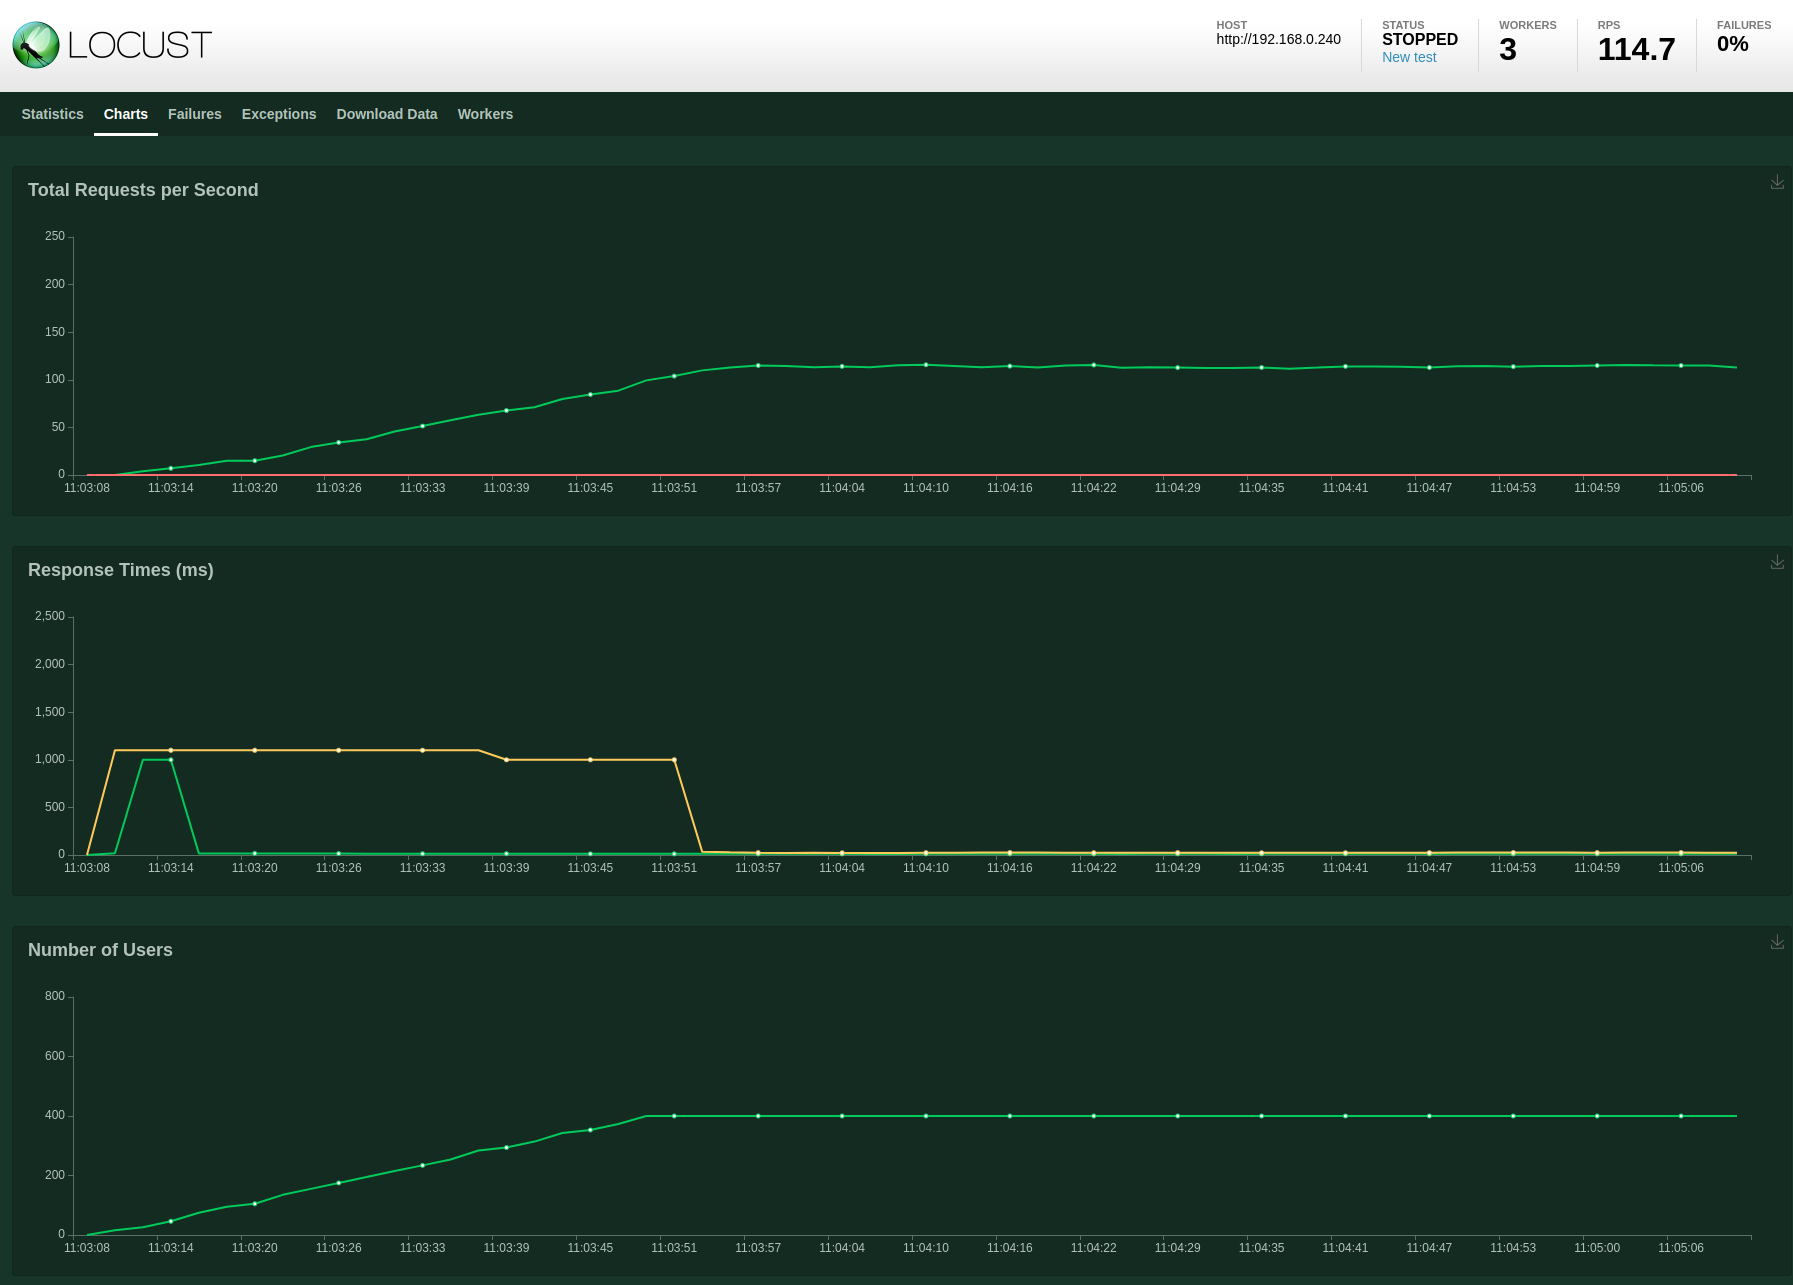
A marked improvement with a 36% higher RPS and 0 failures.
MySQL database with 3x ToDo API, 3x Locust workers and 400 users
For the next test I once again scaled the ToDo API deployment to 3x replicas:
kubectl --namespace todo scale deployment todo-mysql --replicas 3
I ran a new test, keeping the user count at 400:
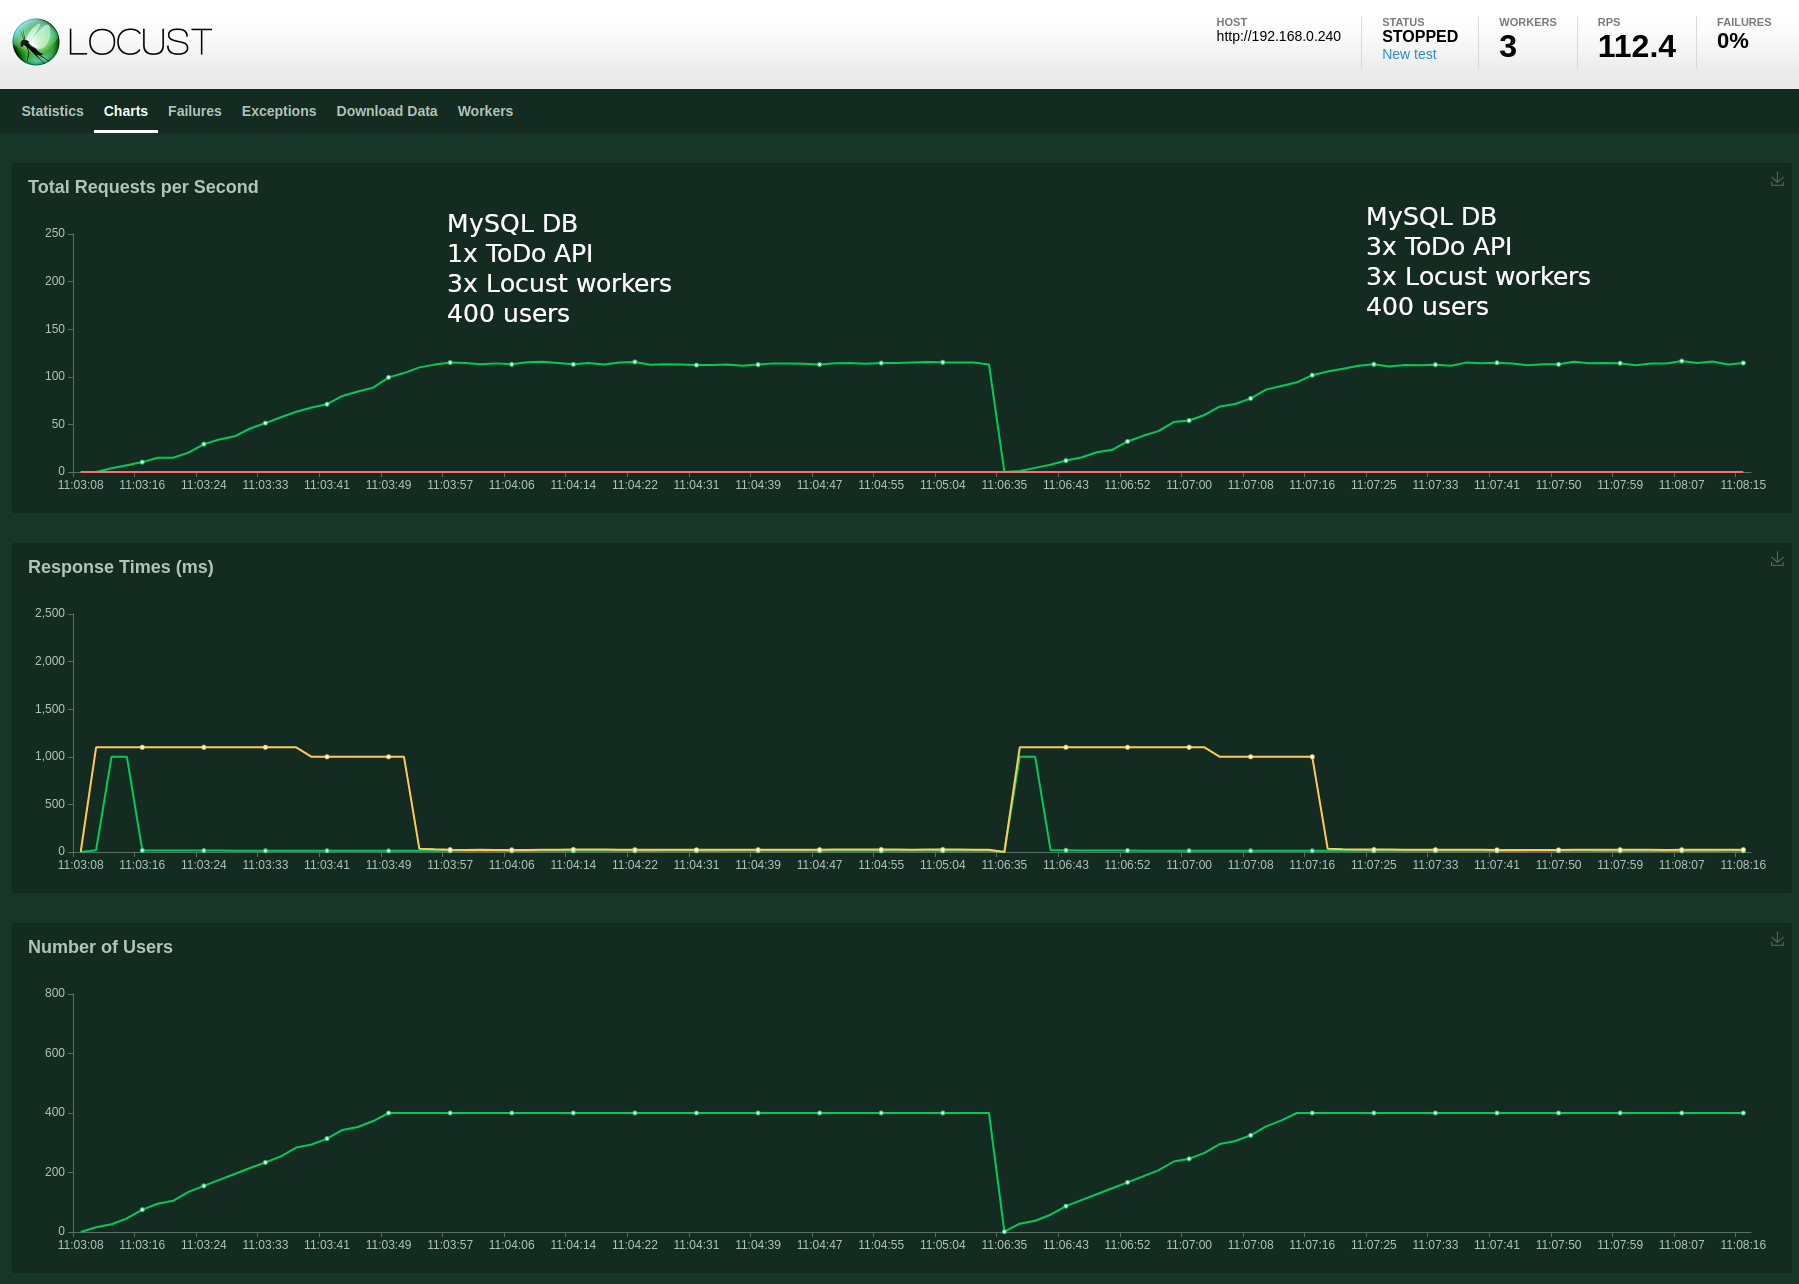
Pretty much the same results. So this tells me that scaling out the ToDo API with the current load and configuration isn’t really necessary.
MySQL database with 1x ToDo API, 3x Locust workers and 2000 users
I moved back to a single replica instance and increased the user count:
kubectl --namespace todo scale deployment todo-mysql --replicas 1
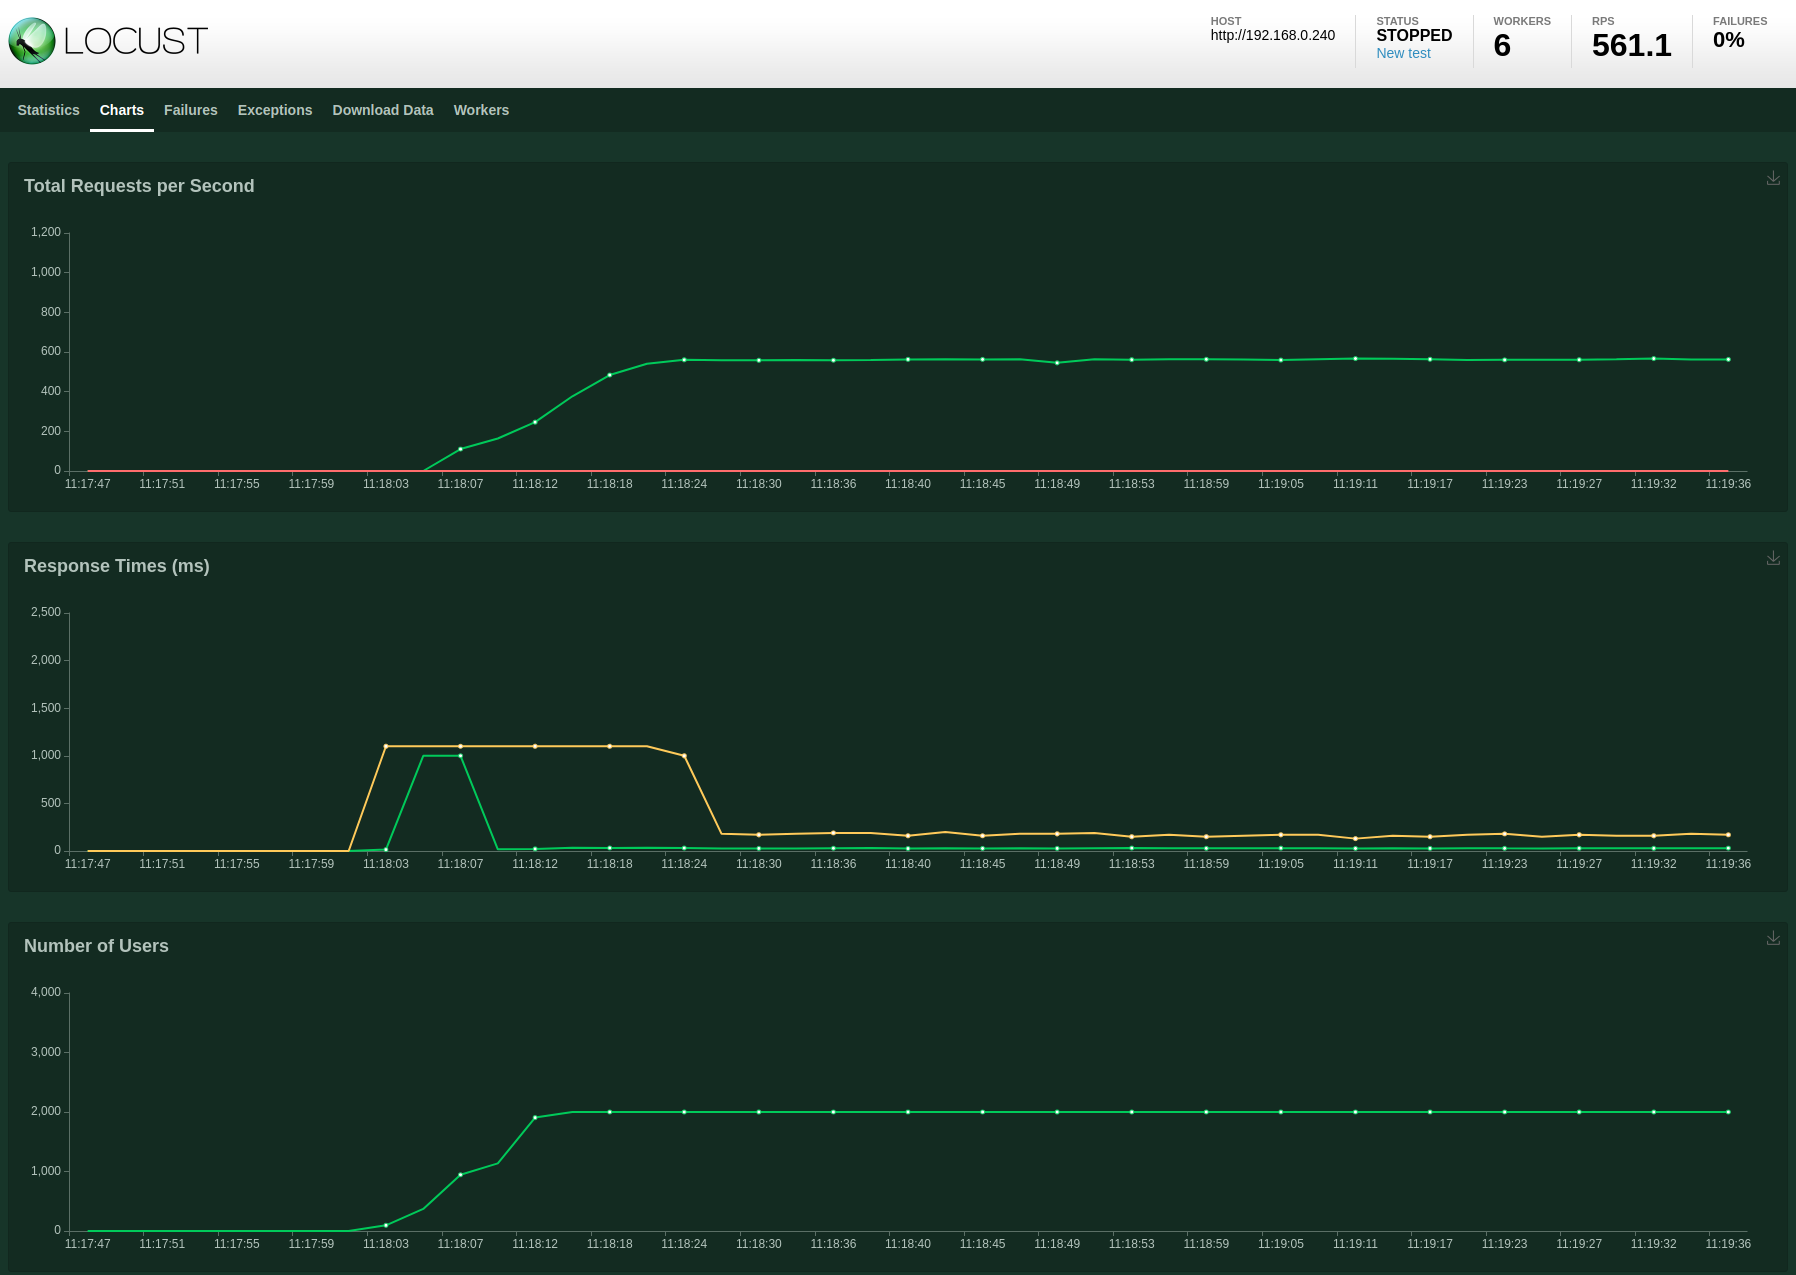
I ran a new test, this time with 2000 users:
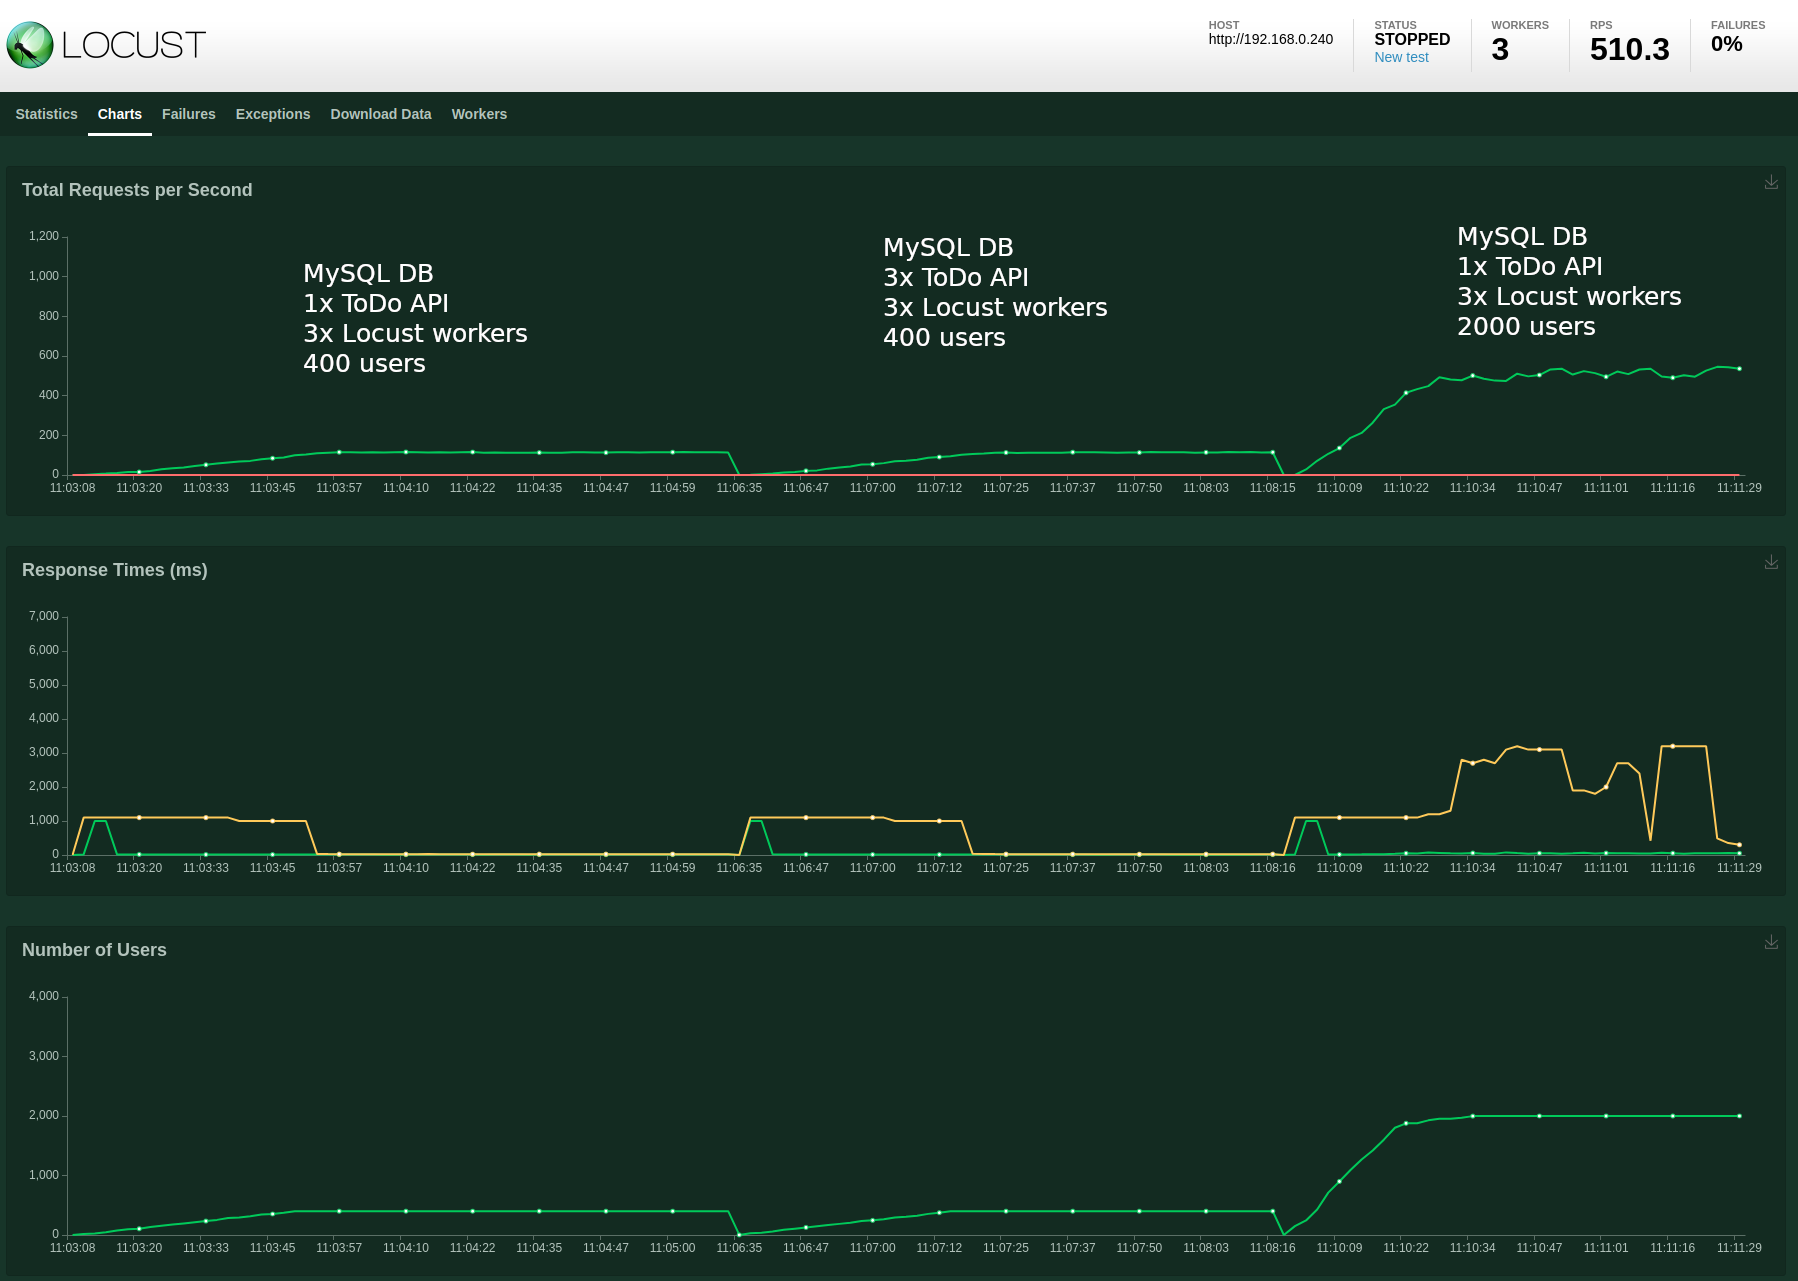
No errors, but definitely see an effect on the response times.
While running this test I took a look at the worker CPU usage, using the Locust UI:
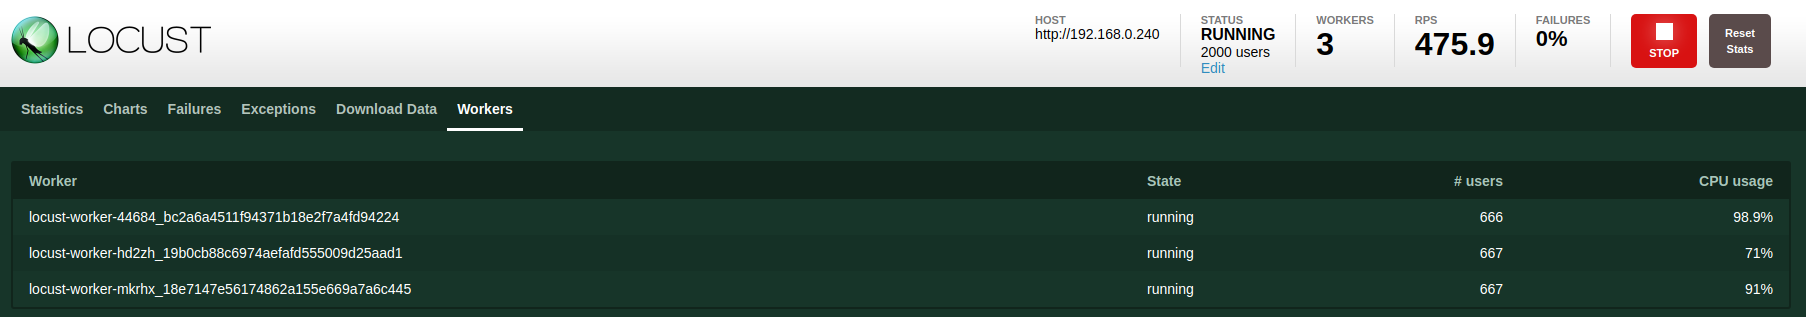
It looks like running 2000 users across 3 workers is maxing out the CPU resources assigned to the worker containers.
DaemonSet to Deployment
Next I wanted to change running the workers as a DaemonSet to a Deployment, which would allow me to specify additional worker pods. Perhaps this will alleviate some of the container resource pressure.
I uninstalled the Locust chart:
helm --namespace locust uninstall locust
And then re-installed it but this time specifying different Helm chart values, changing from the default DaemonSet to a Deployment with 6 replicas:
$ helm --namespace locust install --set workers.kind=Deployment --set workers.replicas=6 locust ./locustchart
NAME: locust
LAST DEPLOYED: Sun Jun 28 11:16:23 2020
NAMESPACE: locust
STATUS: deployed
REVISION: 1
NOTES:
1. Get the application URL by running these commands:
     NOTE: It may take a few minutes for the LoadBalancer IP to be available.
           You can watch the status of by running 'kubectl get --namespace locust svc -w locust-locust'
  export SERVICE_IP=$(kubectl get svc --namespace locust locust-coordinator-service-web --template "{{ range (index .status.loadBalancer.ingress 0) }}{{.}}{{ end }}")
  echo http://$SERVICE_IP:80
The 6 replicas can be observed by checking the pods in the “locust” namespace:
$ kubectl --namespace locust get pods
NAME                                  READY   STATUS    RESTARTS   AGE
locust-worker-759c9f697-8d8dq         1/1     Running   0          24s
locust-worker-759c9f697-qkl2g         1/1     Running   0          24s
locust-worker-759c9f697-b4xz6         1/1     Running   0          24s
locust-worker-759c9f697-kphb7         1/1     Running   0          24s
locust-worker-759c9f697-69fvt         1/1     Running   0          24s
locust-worker-759c9f697-7jpg8         1/1     Running   0          24s
locust-coordinator-6dffd54985-42xht   1/1     Running   0          24s
MySQL database with 1x ToDo API, 6x Locust workers and 2000 users
I then ran a new test with 2000 users, this time using 6 Locust workers:
The RPS is slightly improved and more stable in comparison to the previous test. The response times are also way less erratic. This implies that the increased load on each Locust worker was impacting the test performance, not the application configuration.
MySQL database with 6x ToDo API, 12x Locust workers and 4000 users
For the final test I decided to step up to 6 ToDo API instances, 12 Locust workers and a total of 4000 test users.
kubectl --namespace locust scale deployment locust-worker --replicas 12
kubectl --namespace todo scale deployment todo-mysql --replicas 6
Test results:
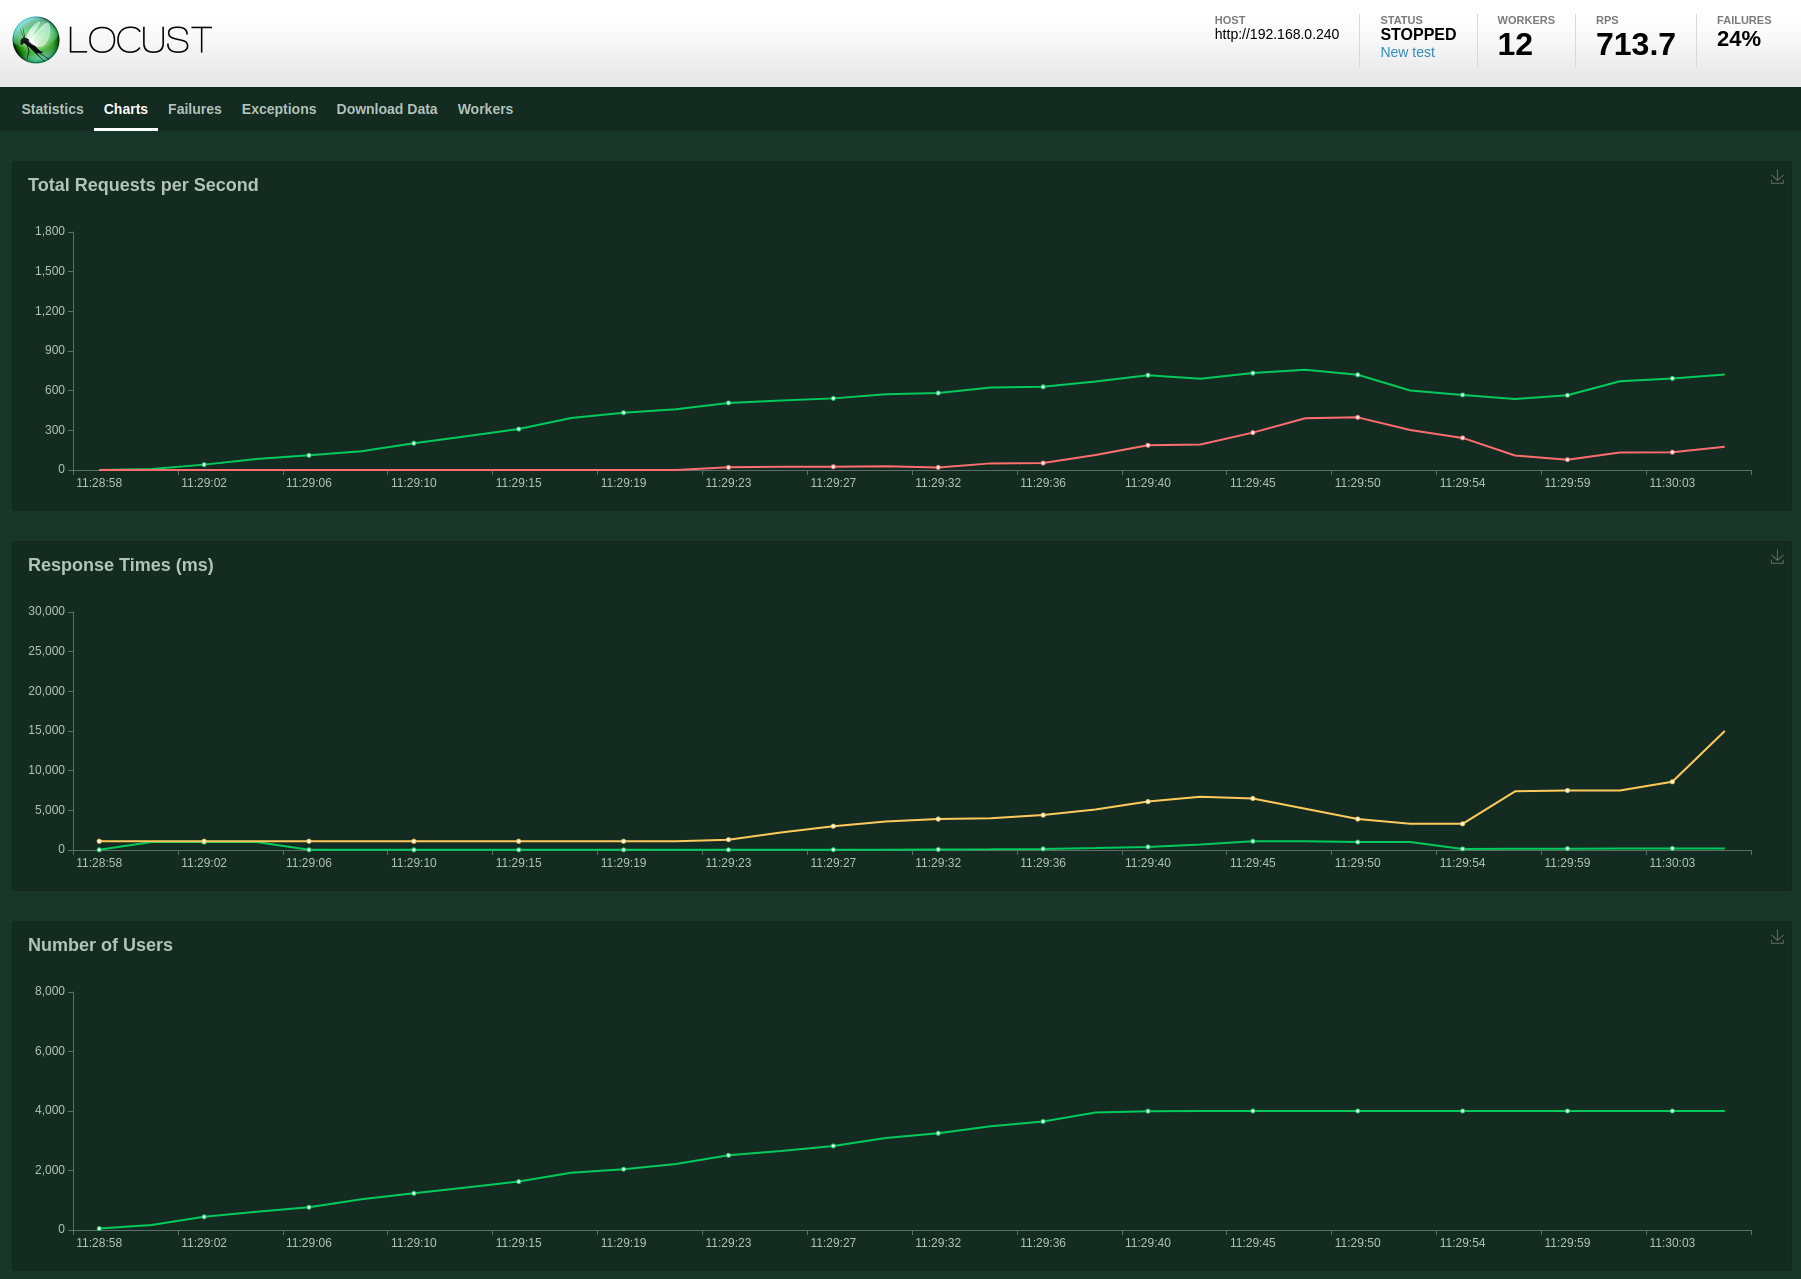
Massive failure rate. Let’s check the logs of one of the ToDo pods:
$ kubectl --namespace todo logs todo-mysql-5cff685dcb-sxhc
Error 1129: Host '10.42.1.6' is blocked because of many connection errors; unblock with 'mysqladmin flush-hosts'
panic: failed to connect to mysql Database with connection string root:password@(mysql-service)/todo?charset=utf8&parseTime=True&loc=Local

goroutine 1 [running]:
main.(*gormdb).init(0x1d97c00)
        /app/gormdb.go:22 +0x200
main.main()
        /app/main.go:39 +0x1e0
Interesting, so it looks like we are seeing DB connection errors. If I were now to start debugging this issue I would start looking at how connections are being created in ToDo API code, checking how many connections are active during the test and how and when are they being terminated. I might make changes to the ToDo API and perhaps even the MySQL config.
Conclusion
I certainly learnt more about running applications in Kubernetes from this exercise. I can see the utility of using a DaemonSet, guaranteeing pods running on each node, as well as working with Helm chart templates, allowing for different installation configurations.
I enjoyed creating my simple Locust script for the load tests. I prefer writing Python code over point-and-click GUI-driven performance test software or crafting XML-driven test configurations.
I already knew that SQLite is not the best database technology for this kind of application and infrastructure configuration but it was nice to see it confirmed using performance tests.